778 "SQUARE-1": VGA/audio demo
778 : "SQUARE-1": VGA/audio demo

- Author: Zachary Catlin
- Description: On video: munching squares. On audio: the logistic map.
- GitHub repository
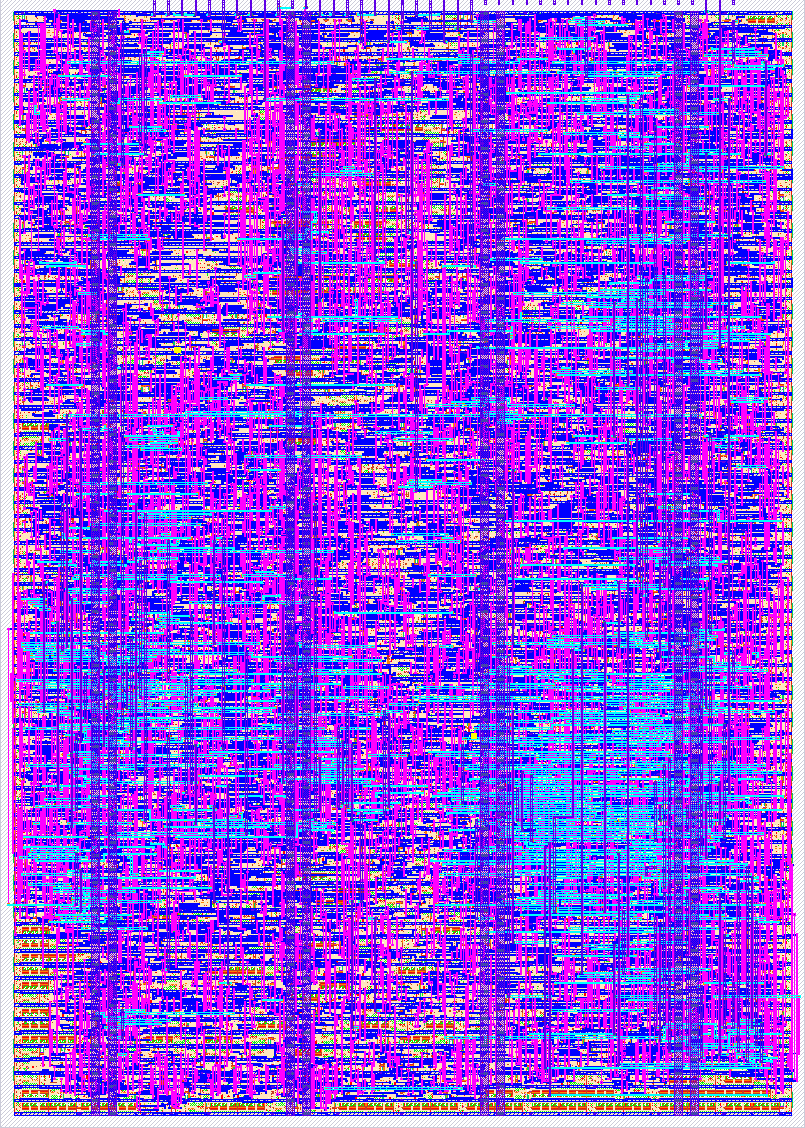
- Open in 3D viewer
- Clock: 25200000 Hz
How to test
Assuming the ASIC is connected to the TT demo board
and suitable interface electronics have been connected (see "External hardware"),
select the tt_um_zec_square1 project to get started.
If rst_n is not automatically set to logic high upon selection, you'll need to manually disable the reset.
Enable the reset again when you're done.
If not using the demo board, you'll need to supply the ASIC with a
25.175 MHz or 25.200 MHz clock,
do the appropriate interactions with the project-selection logic to select tt_um_zec_square1,
and use the pinout to connect
to video and audio output devices. Note: <em>y</em>1 and <em>y</em>0 are the high-order
and low-order bits (respectively) of color component <em>y</em>.
The video part of the demo repeats with a cycle time of ~8.5 seconds, while the audio part repeats with a cycle time of just under 2 minutes.
External hardware
Assuming the ASIC is connected to the TT demo board, VGA output is obtained by connecting a Tiny VGA Pmod or compatible module to the OUTPUT Pmod connector, and audio output is obtained by connecting a Tiny Tapeout Audio Pmod to the BIDIR Pmod connector.
How it works
SQUARE-1 contains a VGA-compatible video demo and an independent audio demo, described separately below.
Video
While the demoscene dates to the mid-1980s, people have been making
aesthetically-interesting graphics with a tiny amount of code for much longer.
One of the earliest "display hacks"
is munching squares, first implemented c. 1962 on
MIT's PDP-1 (hence this demo's name).
The original version has feedback and user-configurability
(see Norbert Landsteiner's write-up for more details and a PDP-1 emulator),
but a simple variant requires only two $N$-bit
variables—t, a frame counter, and y, a row counter, used thus:
t ← 0
loop
  wait for end of frame
  t ← (t + 1) mod 2^N
  for y ← 0 to 2^N-1
    plot (t XOR y, y)
As the algorithm has so little state and involves simple operations, a "racing the beam" implementation requires little silicon area. SQUARE-1 uses $N = 9$ and accepts that the bottom bit of the square gets lost off the 640×480 screen.
However, a simple implementation of the algorithm would not look much like the original version! PDP-1 munching squares uses a Type 30 point display, which was built around a radar-scope CRT using P7 phosphor. P7 is actually a combination of two substances—a bright, short-persistence (decay constant ~20 microseconds) far-blue phosphor excited by the electron beam, and a dimmer, long-persistence (main decay constant ~100 milliseconds, but with a long tail lasting several seconds) yellow phosphor excited by the light from the blue phosphor. As a result, the plotted points have a white or blue-white appearance, then become yellow and visibly fade away.
Fortunately, since each frame only has one point in each line, and said
point is different in each frame, it's easy to parallelize
an emulation of persistence, which is done in src/project.v, which
conceptually works like this:

Apart from the VSync/HSync/coordinate-generating module, it's almost entirely combinational logic. SQUARE-1 simulates 14 frames (~1/4 second) of persistence prior to the current frame—not quite a Type 30, but enough to get the feel of the thing on modern displays.
Audio
The audio demo is a sonification of the logistic map. To give a quick overview, the following iteration:
$x_{i+1} \leftarrow r x_i (1 - x_i)$
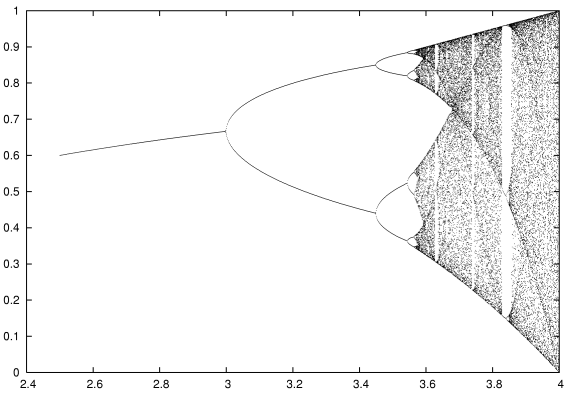
maps values of $x \in (0, 1)$ to values in $(0, 1)$ when $r \in (1, 4)$. When $r \in (1, 3]$, the sequence of $x_i$ values converges to a single value (the attractor), but much more interesting behavior happens when $r \in (3, 4)$:
 <br />Credit: Ap on en.wikipedia.org
First, the attractor becomes a period-2 cycle, then period-4, -8, -16… and then it exhibits chaotic behavior. That iteratively applying a quadratic polynomial would result in such behavior came as quite a surprise back in the 1960s, and to this day the logistic map is a popular demonstration of mathematical chaos in a simple system.
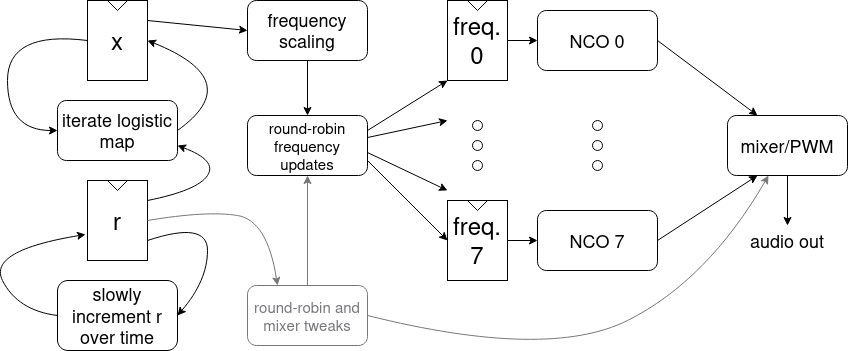
So, what does it mean to turn the logistic map into a sound? The way SQUARE-1 does it, values of $x_i$ at a given $r$ are scaled from $(0, 1)$ to approximately $(200, 1200)$ Hz, which are then used as the frequencies of an ensemble of 8 square-wave generators. The square waves are then added together and used as the input to a PWM generator, the last providing the sound output. $r$ is varied to cover the range $[\tfrac{17}{16}, 4)$ over a period of ~2 minutes, varying faster over $r < 3$ to get to the good stuff sooner.
Finally, over a few small portions of the chaotic region, we change the number of square-wave generators that get frequency updates and get mixed together. The reason is that within the chaotic region, there are islands of periodicity, the largest of which have attractors of period 3, 5, and 6. Tweaking the number of active generators to be a multiple of the period leads to better-sounding results within the islands.

Greetz
Eh, I'm not that social…
…Hi, Mom! Hi, Dad!
Well, also, thanks to the organizers of the TT08 demoscene competition for finally inspiring me to get off my rear and go sculpt some silicon. Thanks as well to the open source EDA and silicon communities for making all this feasible.
IO
| # | Input | Output | Bidirectional |
|---|---|---|---|
| 0 | R1 | ||
| 1 | G1 | ||
| 2 | B1 | ||
| 3 | VSYNC | ||
| 4 | R0 | ||
| 5 | G0 | ||
| 6 | B0 | ||
| 7 | HSYNC | PWM audio out |