Interacting with projects and making measurements with the Analog Discovery
This is an example of using the Digilent Analog Discovery 3 multi-function test and measurement device to characterize a project on the Tiny Tapeout 05 ASIC, in particular #271: Analog Testmacro, which is a test analog circuit included on TT05 containing both a ring oscillator and a 3-bit DAC.
There is a sample WaveForms workspace that is ready to use that can
- Talk to the demoboard REPL over serial to setup the correct project,
- Drive the demoboard inputs to dynamically control the project,
- Monitor and measure the ring oscillator and DAC outputs, and
- Graph the results and output CSV files with data.
The purpose here is to walk-through the entire process while introducing various features of the AD3 and some of the ways to use it.
WaveForms Installation
To play along, an Analog Discovery 3 is required, as is its front-end application, “Waveforms”. Follow the AD3 Getting Started Guide to get everything setup and test that it is working.
Running The Full Test Suite
We’ll walk through every important step, below, and that is a good way to get to know the Analog Discovery. However, if you want to just get going and explore things on your own, you can wire things up, load the provided workspace on the AD3 and follow the bullet point list of steps.
What you need
- An Analog Discovery 3 and its WaveForms program installed, connected to the computer;
- The tt05analogdemoFull.dwf3work workspace opened in WaveForms;
- A TT05 demoboard and ASIC, also connected to the computer via USB;
- The AD3 and demo board correctly wired
The basic wiring is:
AD3     Demoboard Input
1+      m33 (top header)
1-      GND (top header, but really anywhere on demoboard)
2+      m35 (top header)
2-      GND
0       in0
1       in1
2       in2
3       in3
9       in5
10      in6
GND     GND
If you also want to run the oscillator frequency vs core voltage characterization, you’ll need to
- depopulate F2 from the demoboard
- wire V+ from the AD3 to the 1V8 pin on the demoboard top header
This is optional and you can skip the test when prompted.
or simply get the boring result of no-frequency-variation (since the core voltage won’t actually be set by the AD3).
How to run
We’ll walk through these steps one at a time, below, but if you’d like to just get started and run the test suite, these are the steps. Following the entire sequence is only important if you’ve set things to drive the core supply from the AD3, but it doesn’t hurt even if you haven’t.
- Connect the AD3 to USB
- Open the WaveForms program and load the workspace file
- Switch to the Supplies tab, ensure Positive supply is set to 1.8V and press the “play” button on that tab to enable the core voltage. Make sure both the “master enable” and “positive supply” have green checkmarks;
- Switch to the Script tab, find the powerupHighZ tab in there and press its “play” button to run it, then click Yes to the “Do you want to put all DIO into High-Z” prompt
- Connect the demoboard to USB
- Press “play” button on the demoboardsetup script tab, and specify the correct “com port” (ttyACM0 is the default, and usually valid, under linux)
- Press “play” on the powerupHighZ, again… but this time click “No” to the first prompt and then “Yes” to “Do you wish to restore Patterns signals to PP?”
Now, everything should be in a good state, and you shouldn’t have to go through that dance again unless you power down.
Clicking the “play” button on the tests tab in Script will run the tests–simply follow the prompts.
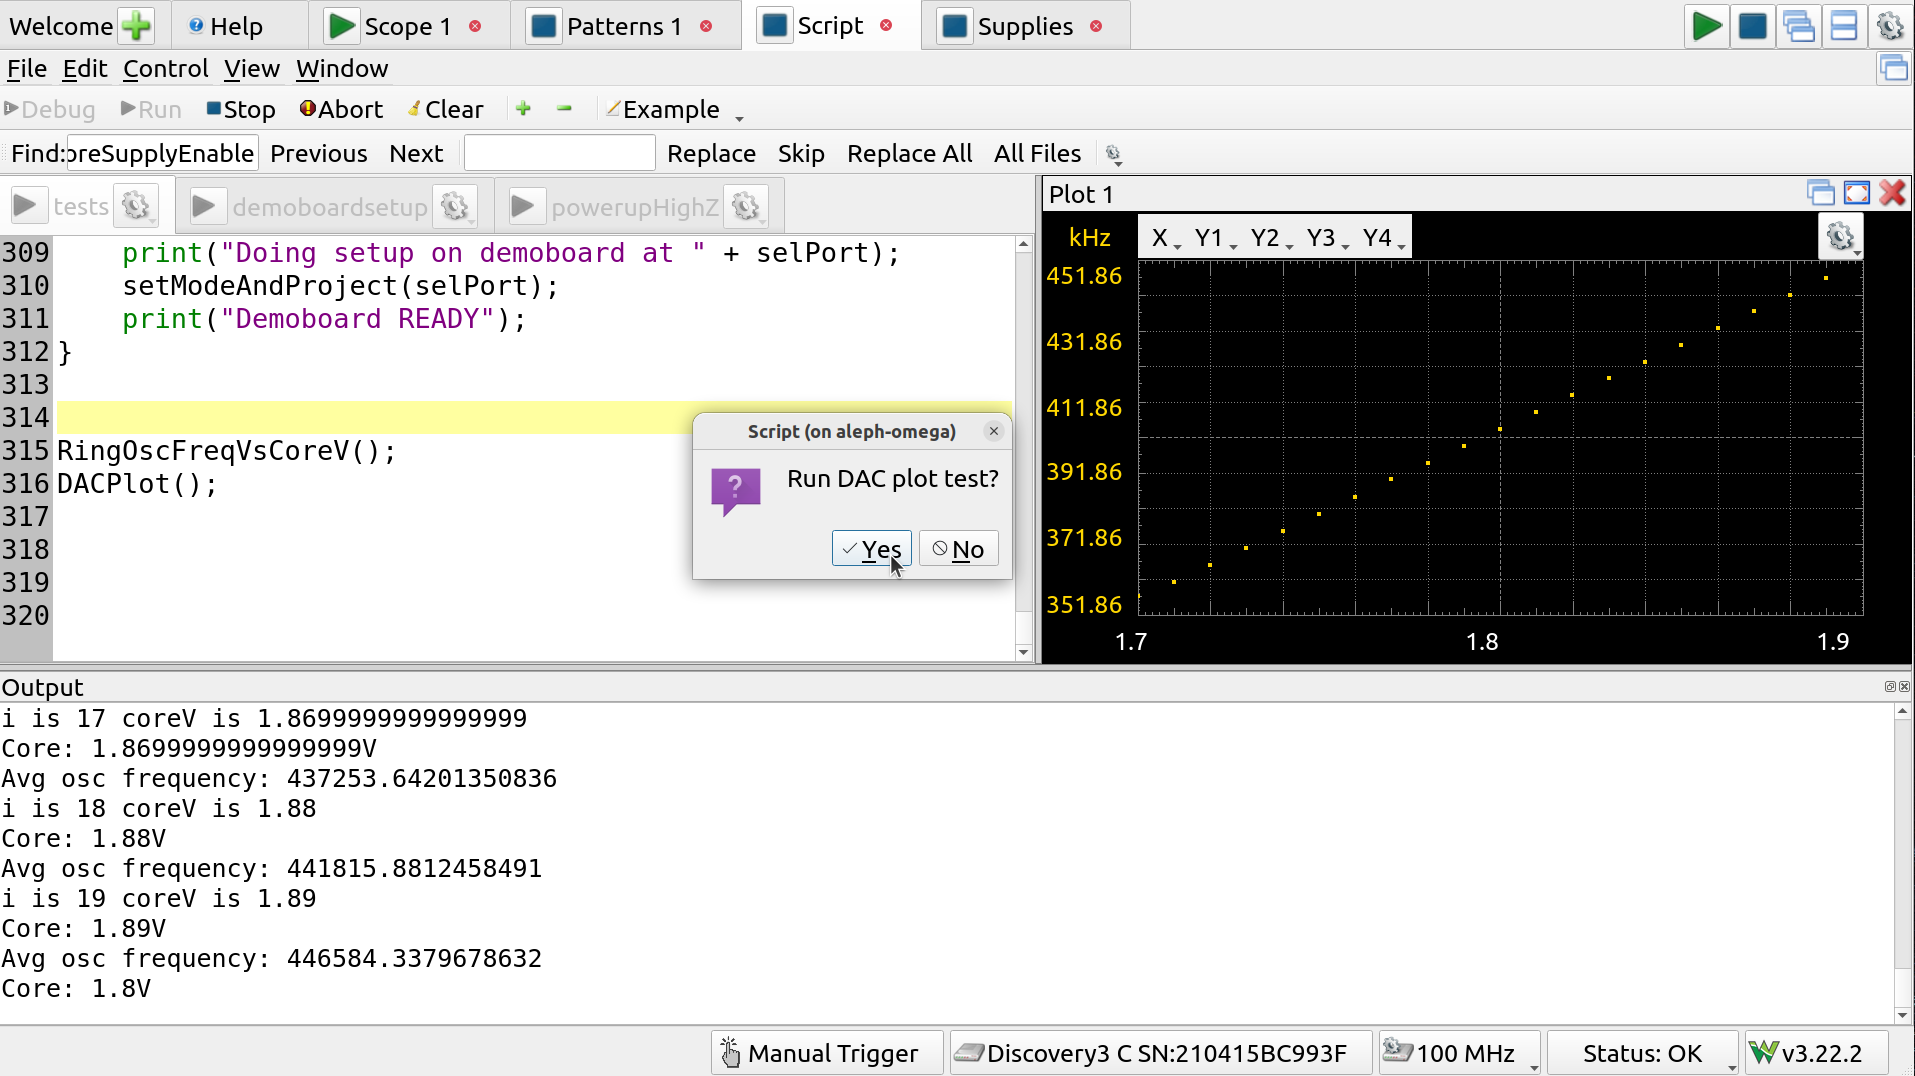
DAC plot prompt
Full Walkthrough
The Oscilloscope
When you launch waveforms you get a welcome screen with all the available instruments.
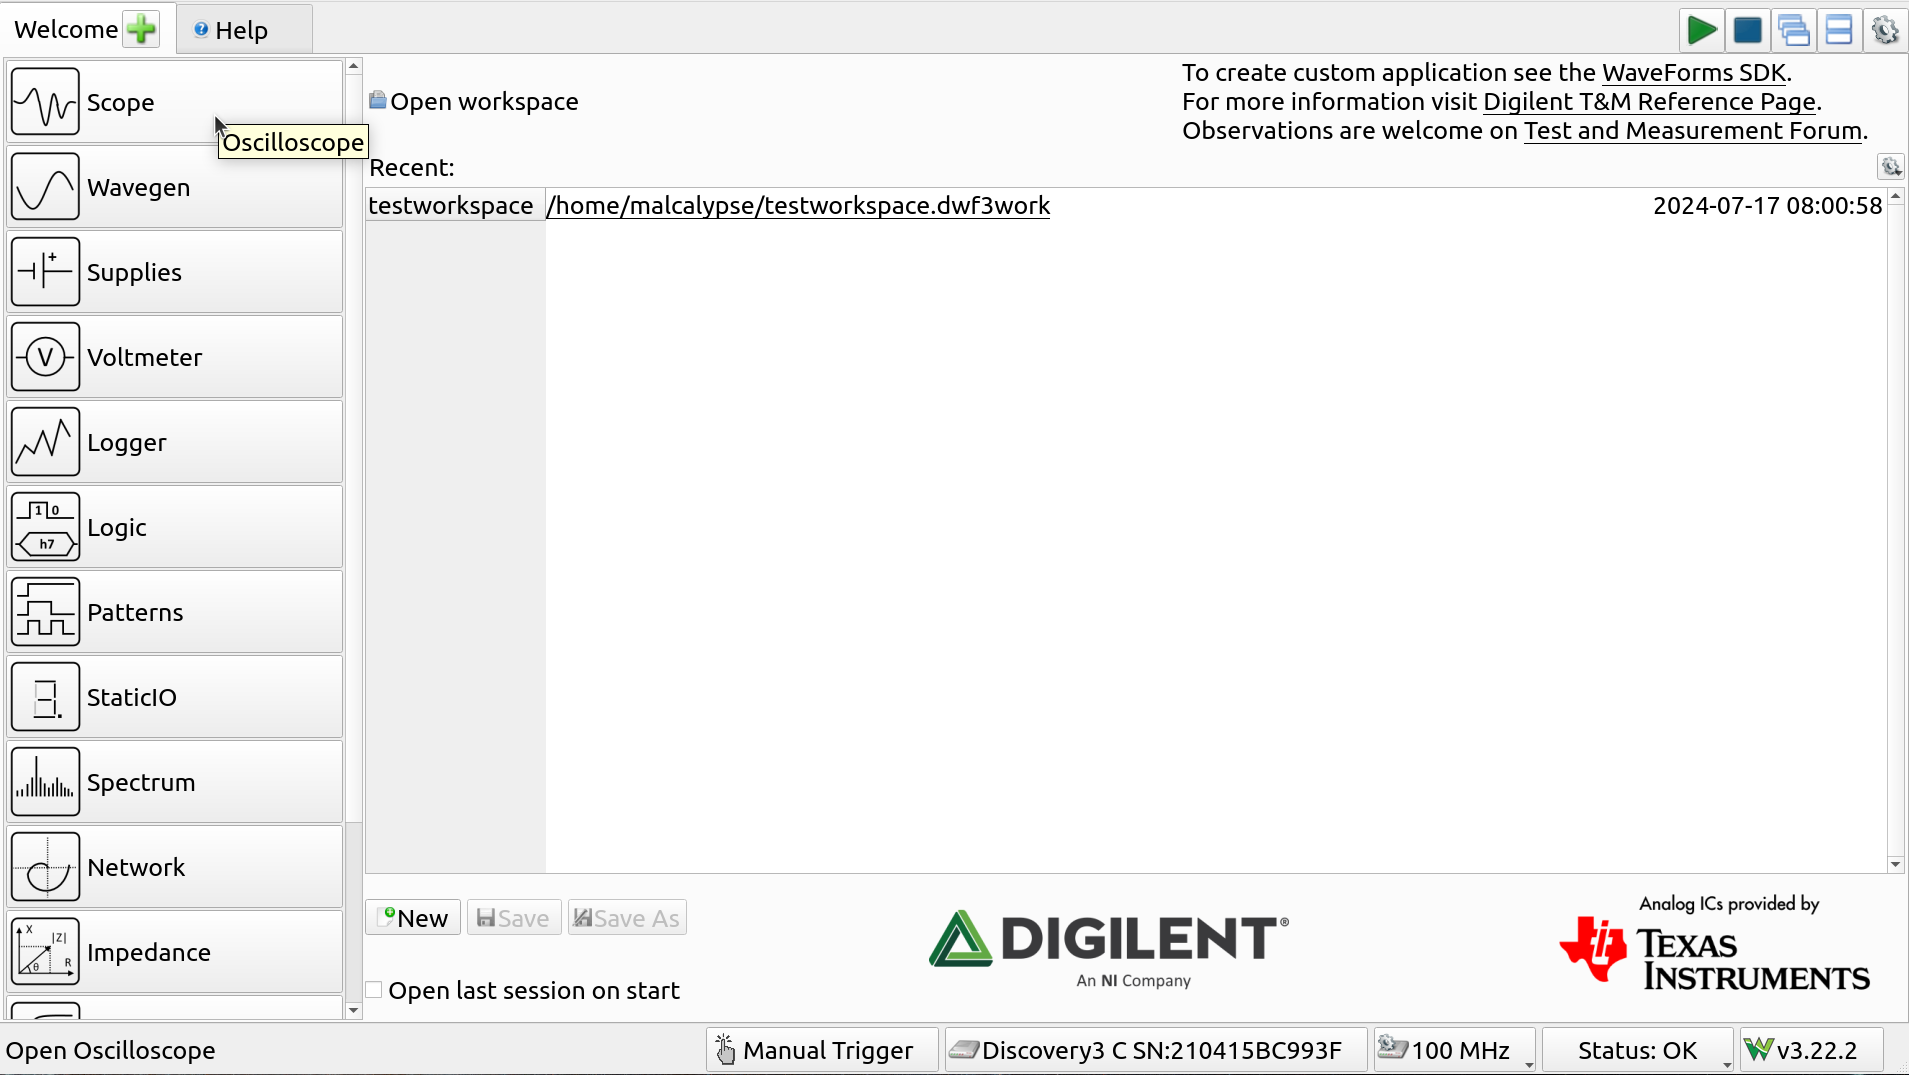
Welcome Screen
If you click on one of them, for example the oscilloscope, it will open up a new tab with that instrument panel.
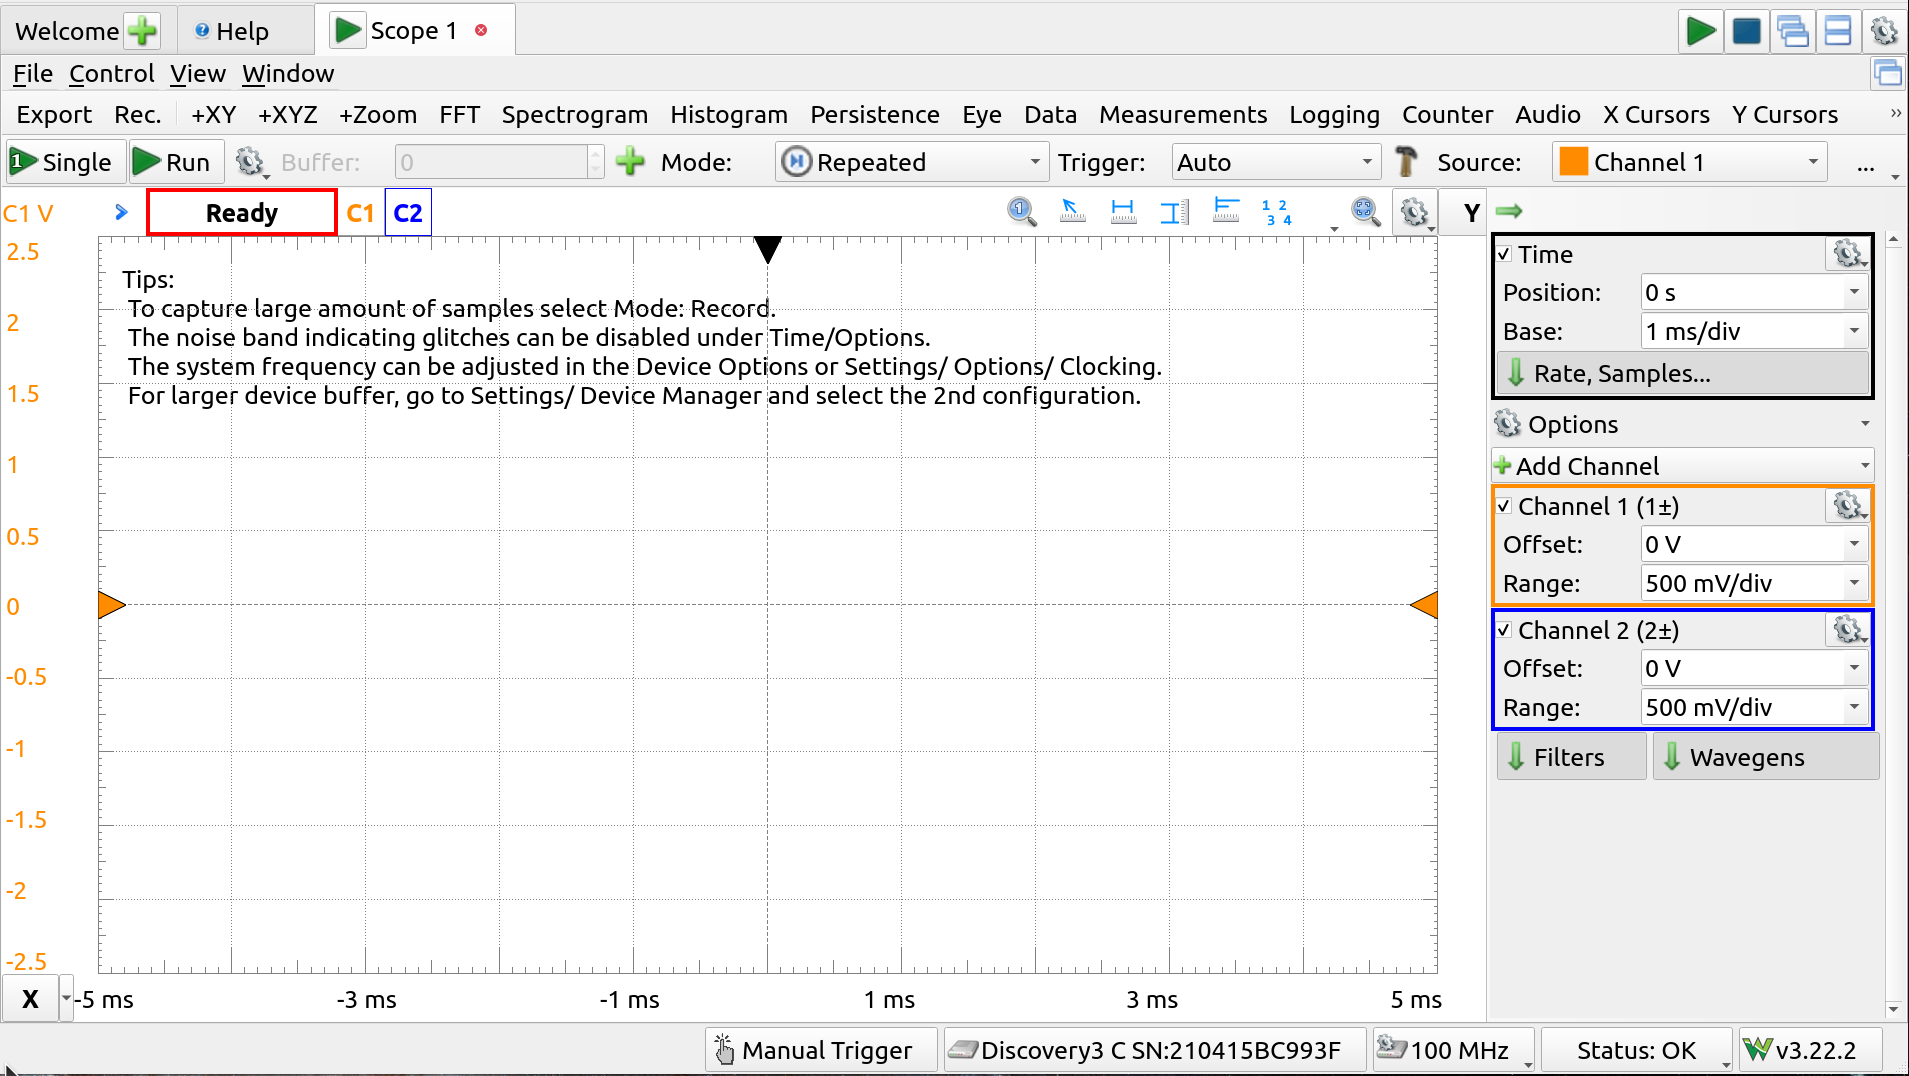
Oscilloscope
The oscilloscope has two channels, aptly named 1 and 2. Each channel has a + and a - pin. In this case, the
- 1+ is connected to the m33 pin in the top header (the ring oscillator output),
- 2+ is connected to the m35 pin (the DAC output), and
- Both 1- and 2- are connected to GND pads.
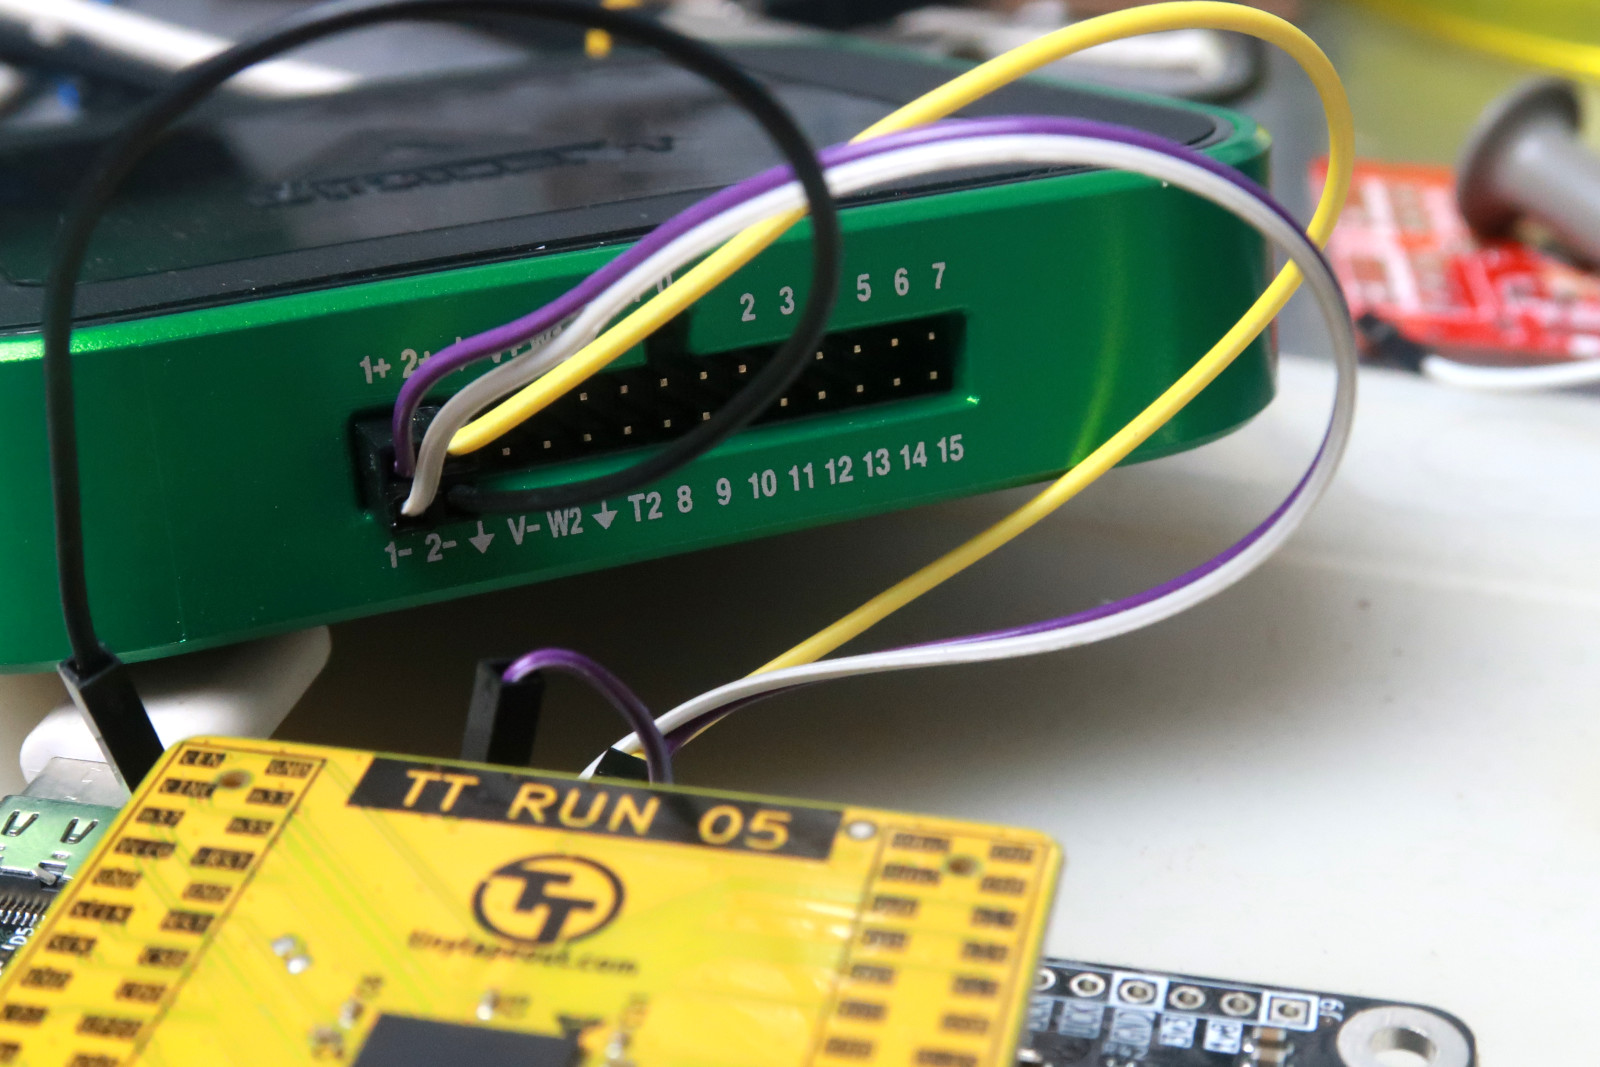
AD3 Scope connections
Ring Oscillator
For this to work, the analog test project must loaded and configured. This may be done through the commander app, but it’s sometimes quicker to connect to the REPL directly via a serial terminal and use the SDK directly to:
- Load the project, by calling enable() on the project in the shuttle, and
- Set the input bits so that the ring oscillator is on, using the input_byte to set all the bits in one go
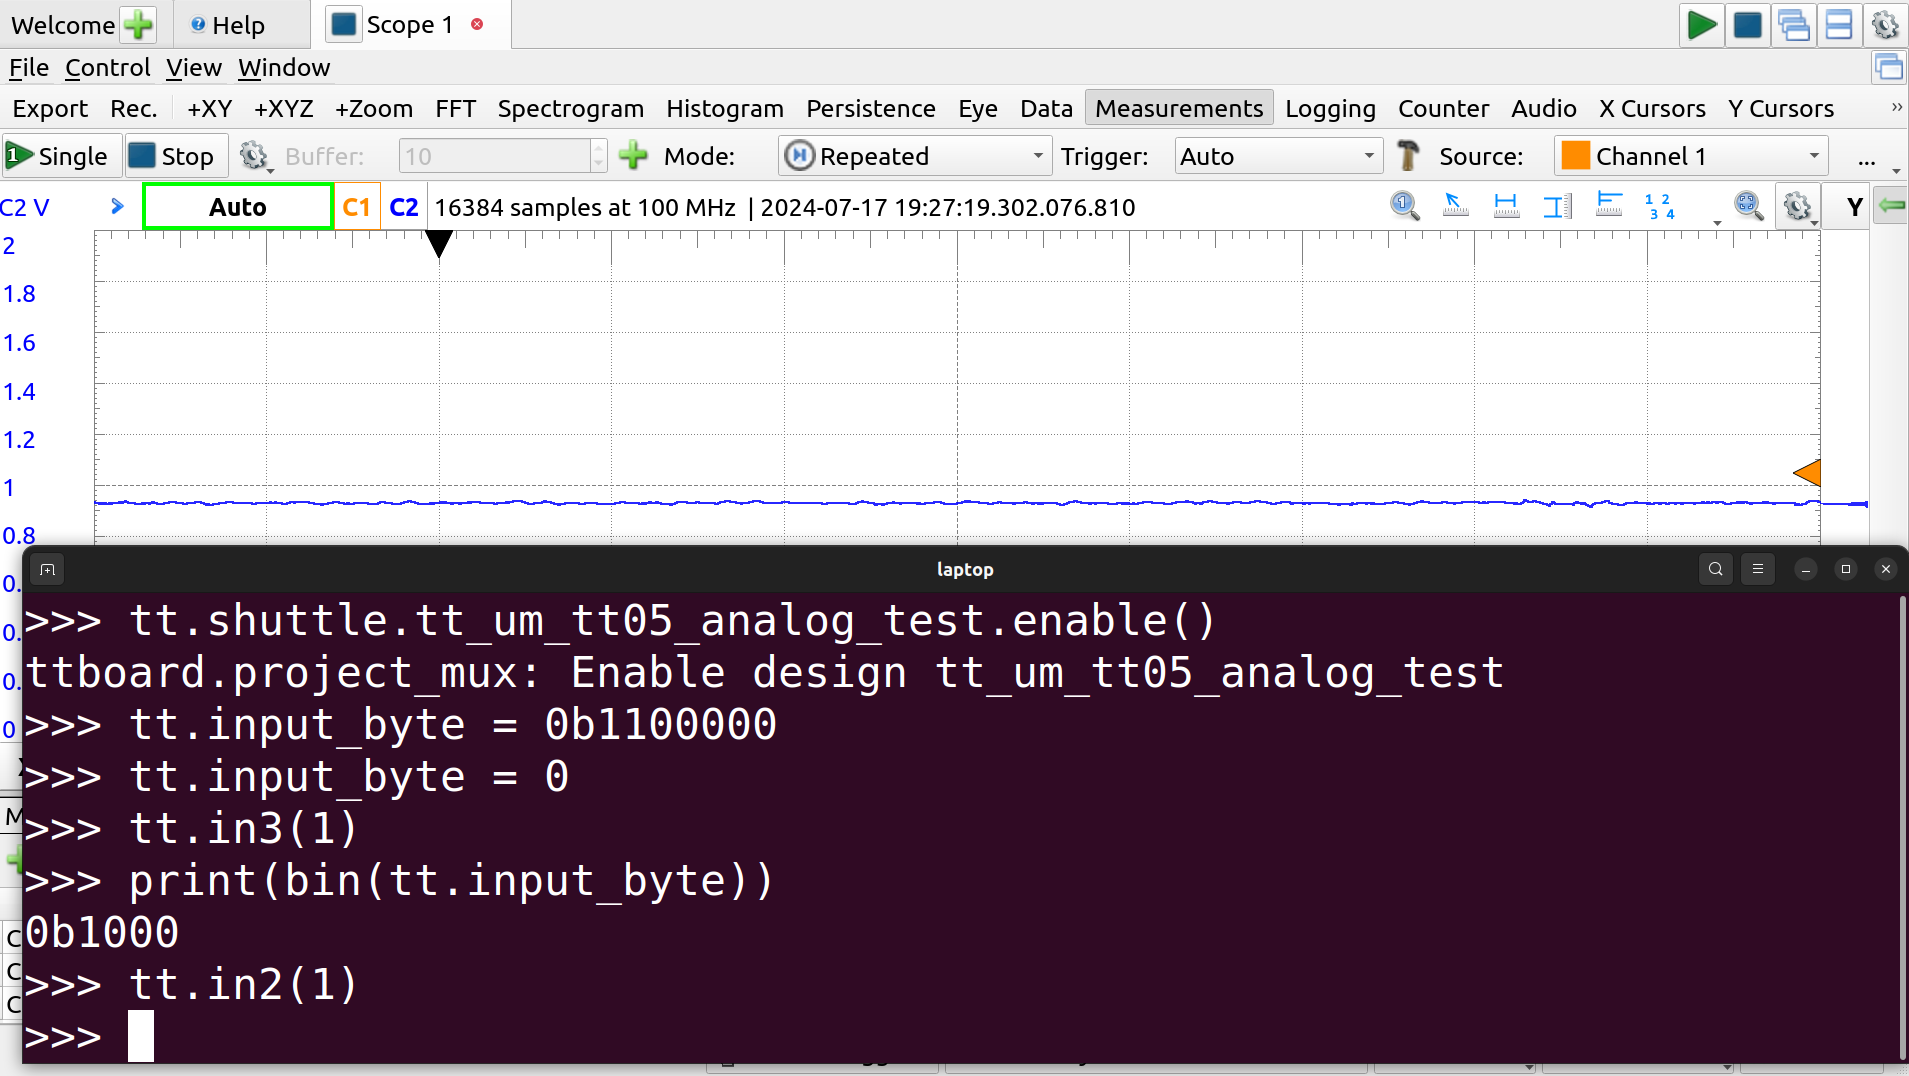
Here, we won’t use the commander. The script in the workspace will connects through the serial port and issues the required commands. Doing it manually looks like this when connected to the REPL:
>>> tt.shuttle.tt_um_tt05_analog_test.enable()
ttboard.project_mux: Enable design tt_um_tt05_analog_test
>>> tt.input_byte = 0b1100000
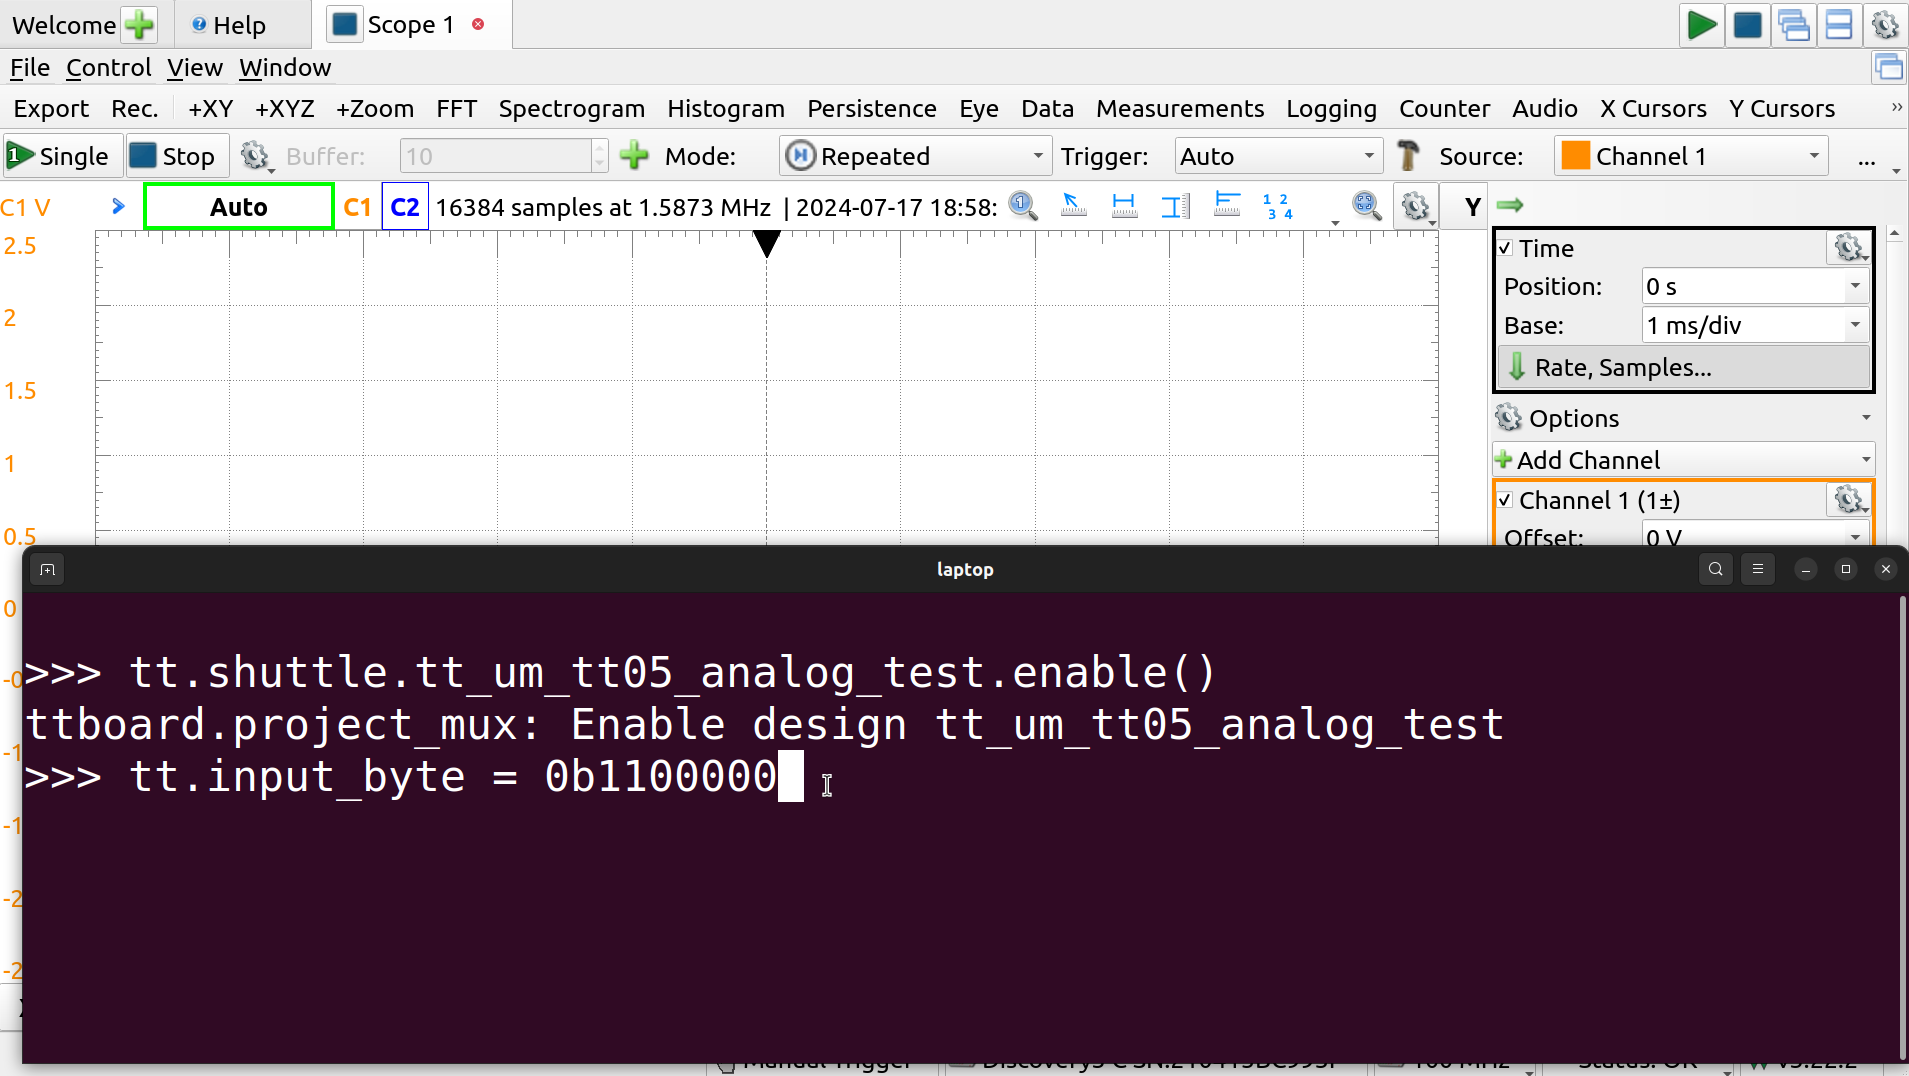
REPL interaction
The ring oscillator should now be running, output on the pin connected to channel 1 and visible in the scope (click Run–the “play” icon–if you can’t see it, or check the connections).
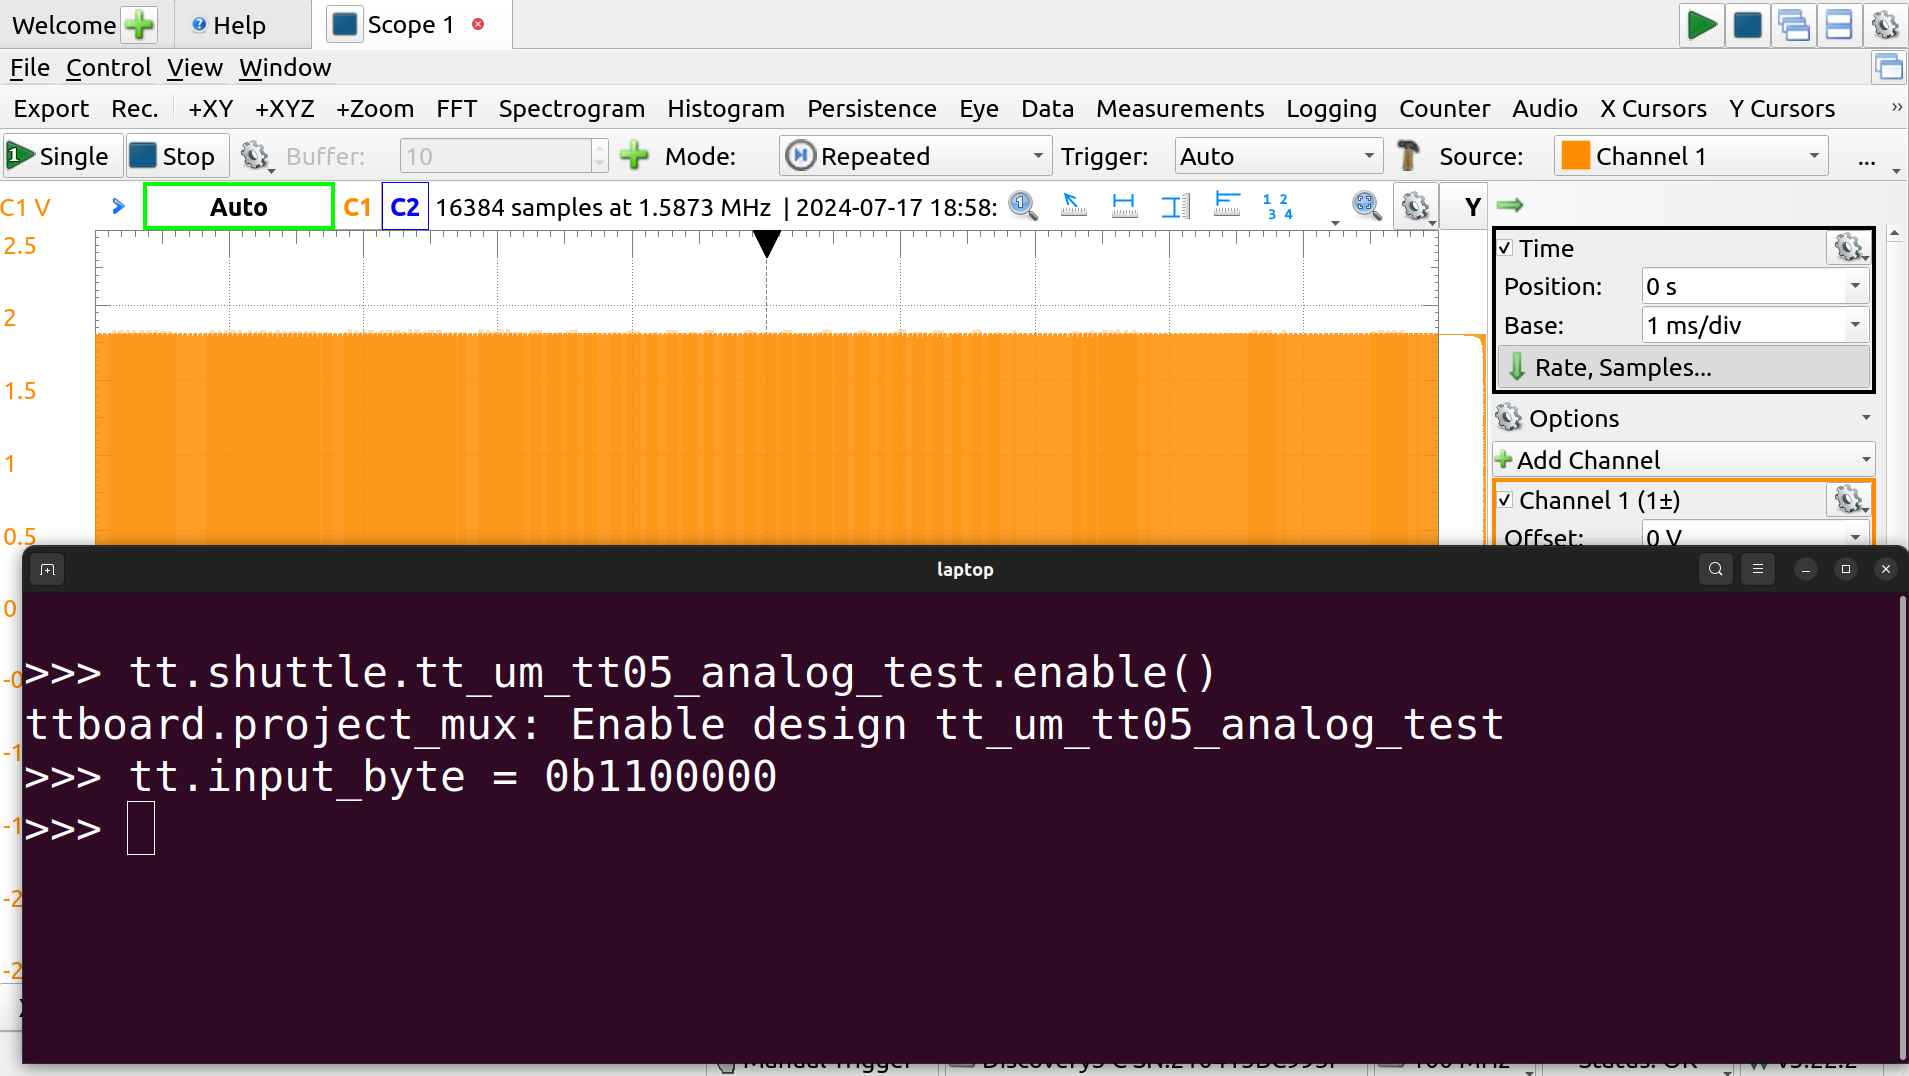
OSC on scope
The scroll wheel to zoom in and drag the trigger level (yellow arrow on right side) to get something stable. Use the range on the right to get a better look by stretching it vertically, and drag the offest arrow on the left to position it.
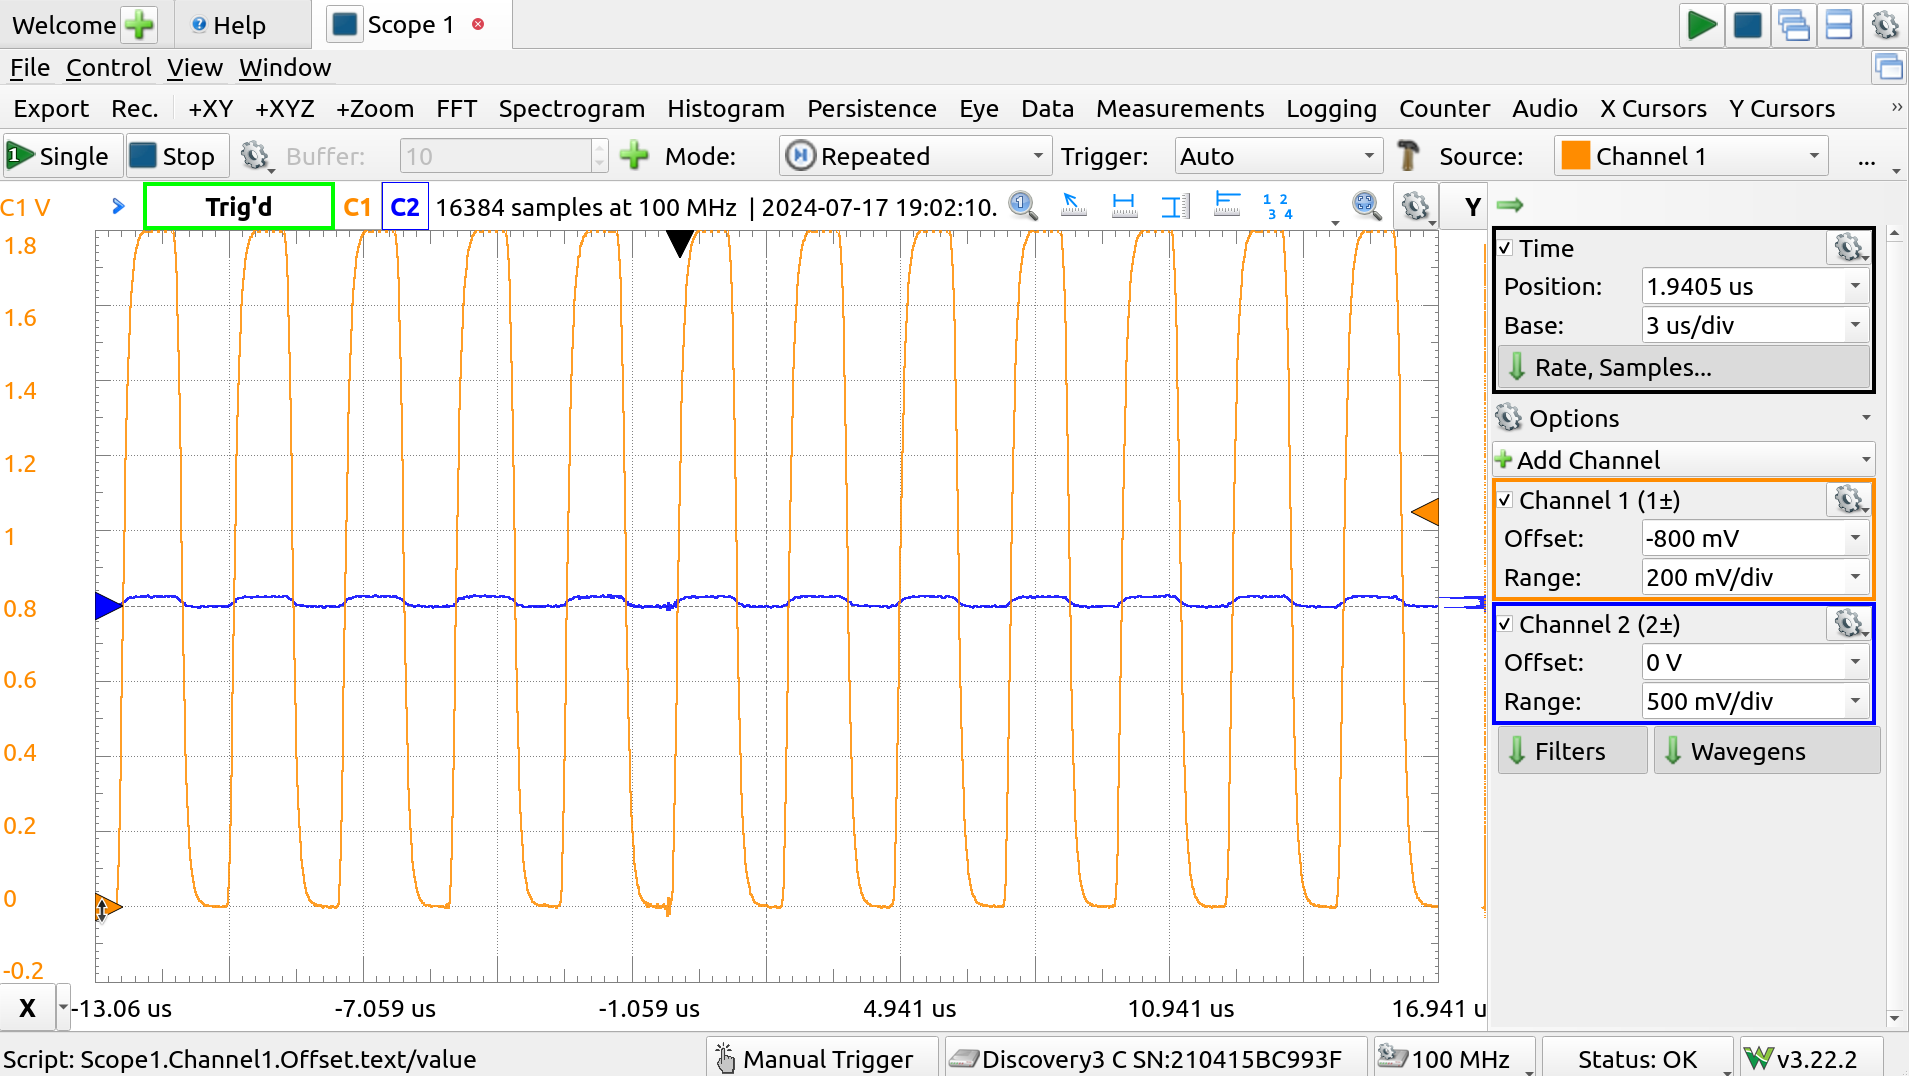
OSC zoomed in and stable
Disabling channel 2 for now, using the checkbox, clears up the display, and the measuremnt tools may be use to look at width (time intervals), height (voltage) and pulse length. These are easy to use with the mouse: just click on a location to begin a measurement, and a second location if it involves a delta.
Clicking again will start a new measurement, double-clicking clears away the tool.
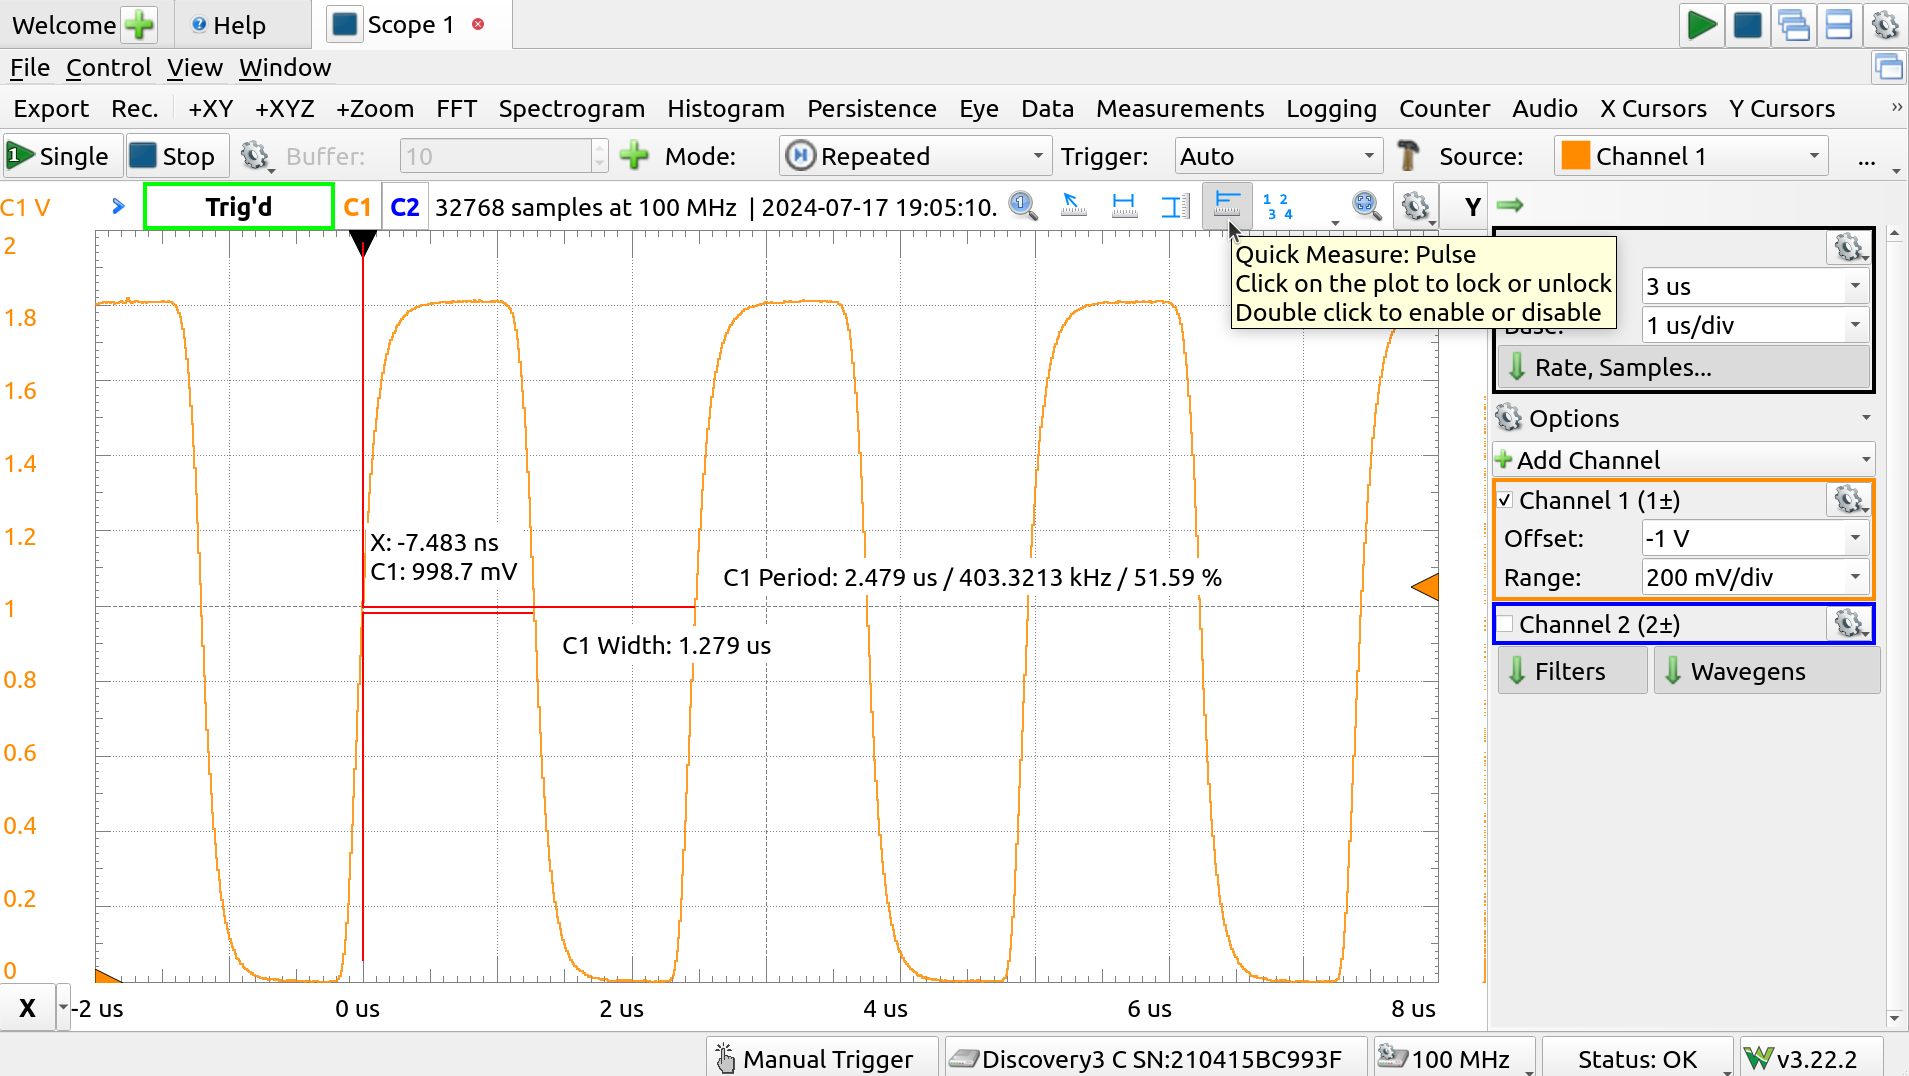
OSC pulse measurement
The pulses do seem to go from rail to rail but, using the pulse measurement, the period can be seen to be a little over 400kHz, which is about 100kHz under the expected value.
There are numerous tools available on the scope. For automated measurements of many types, click “Measurements”. This opens another pane.
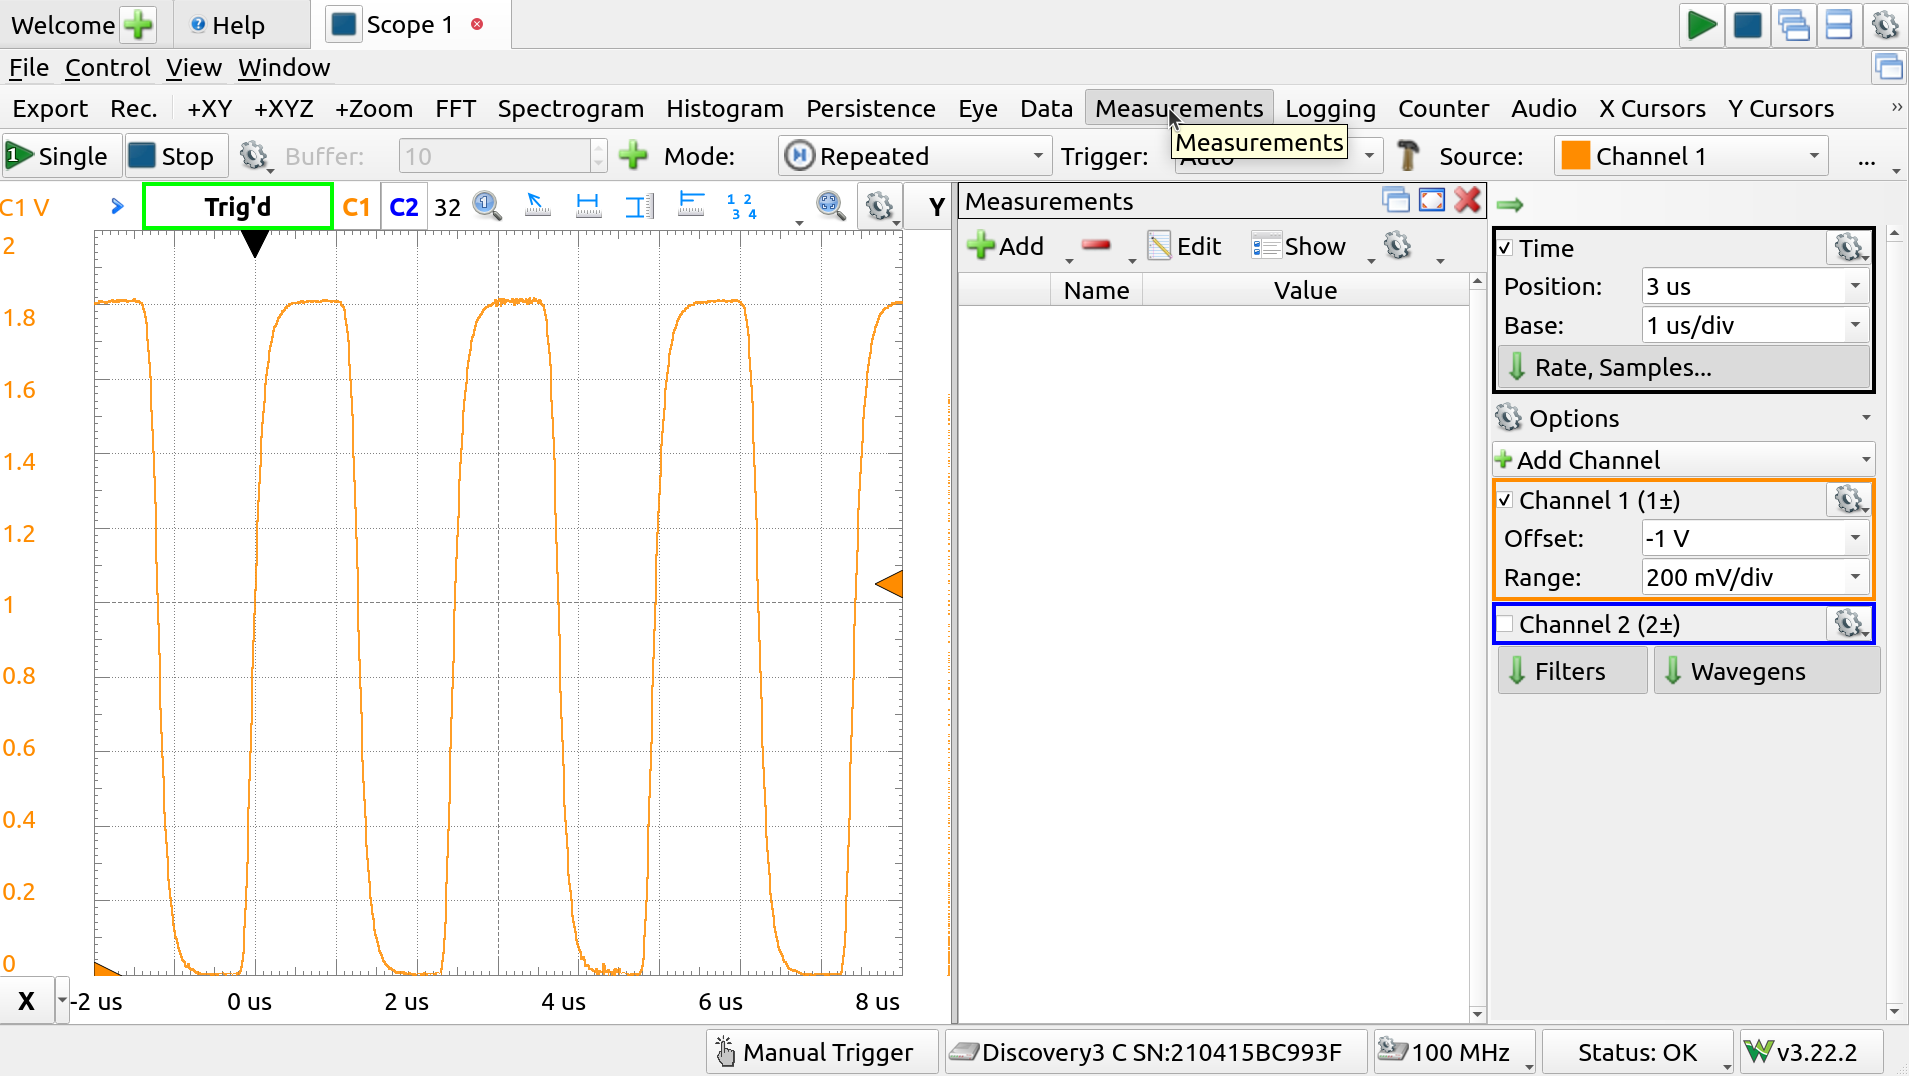
Measurements pane
Things can get crowded, so two interesting things to note are:
- The arrow above the channel pane allows it to be set to auto-hide, and
- Grabbing a pane by it’s title, “Measurements” here, allows it to be dragged to other positions.
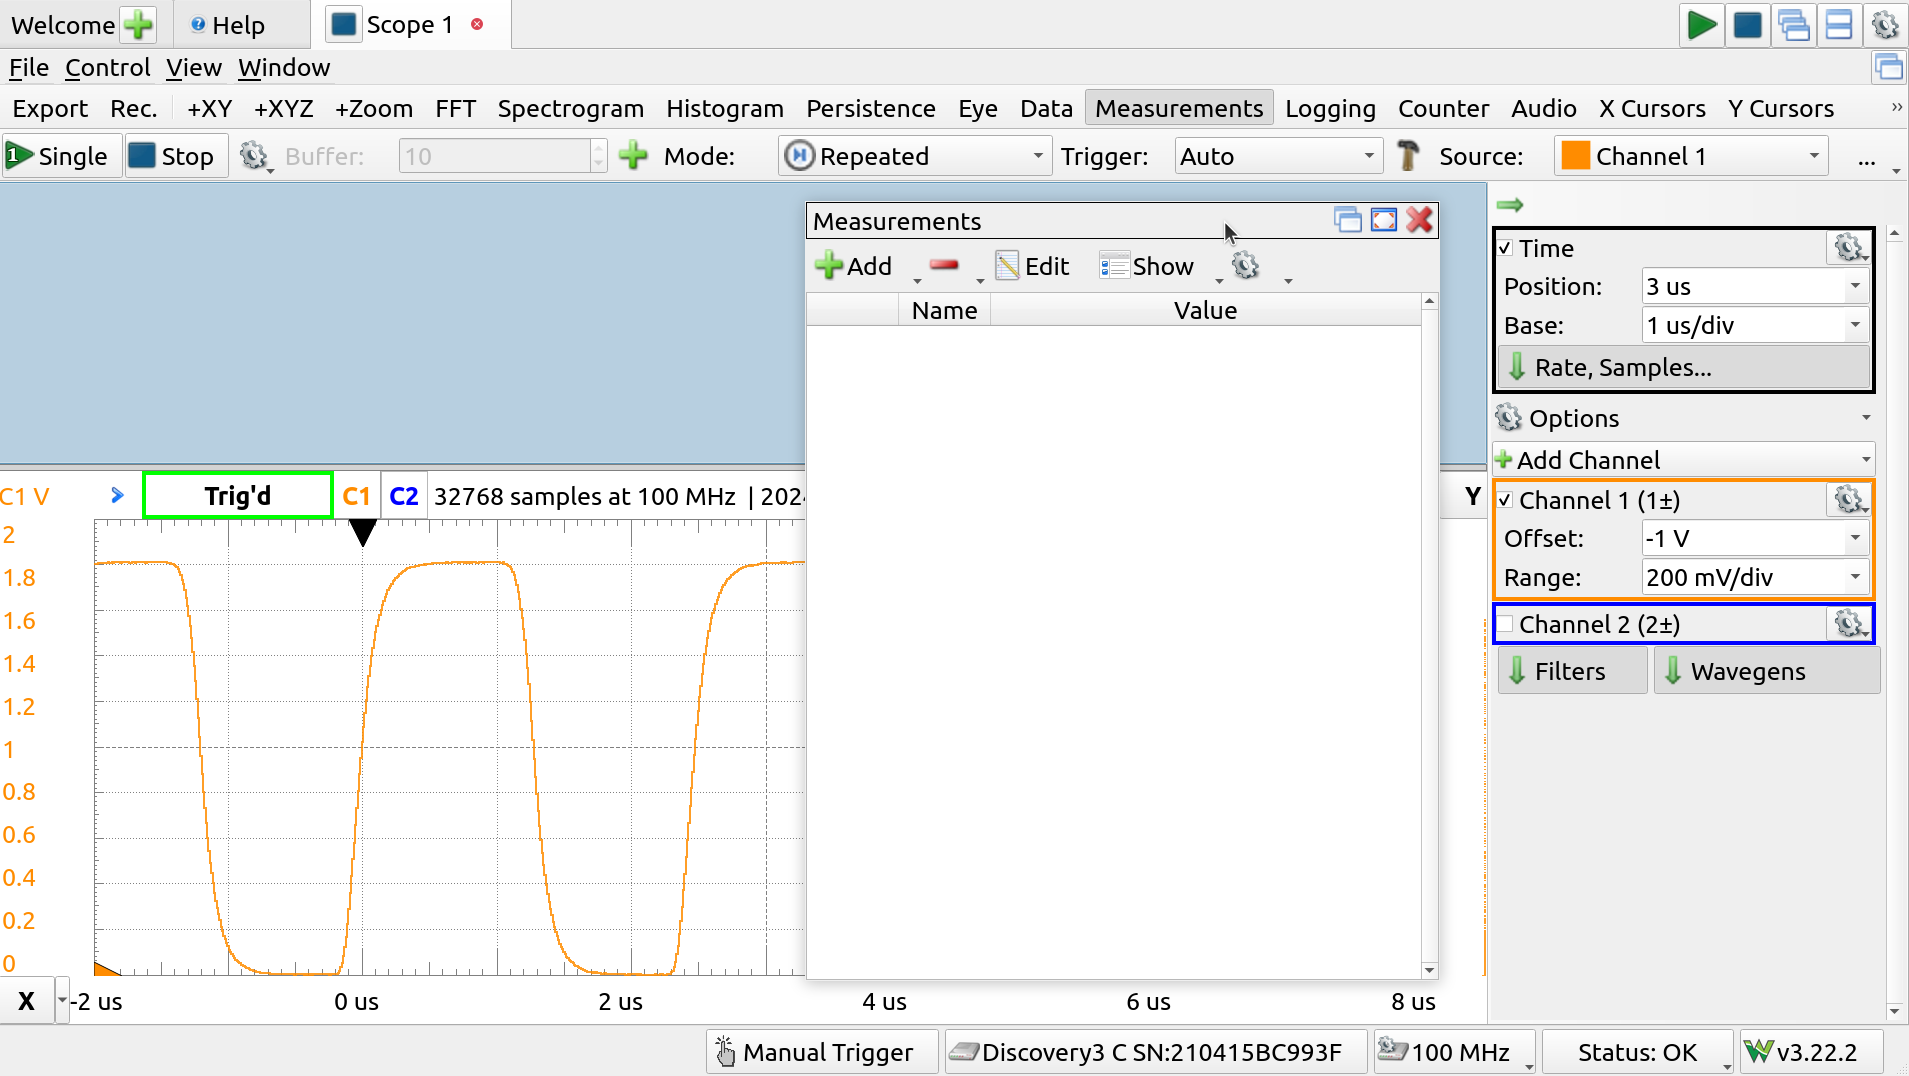
Measurements pane reposition
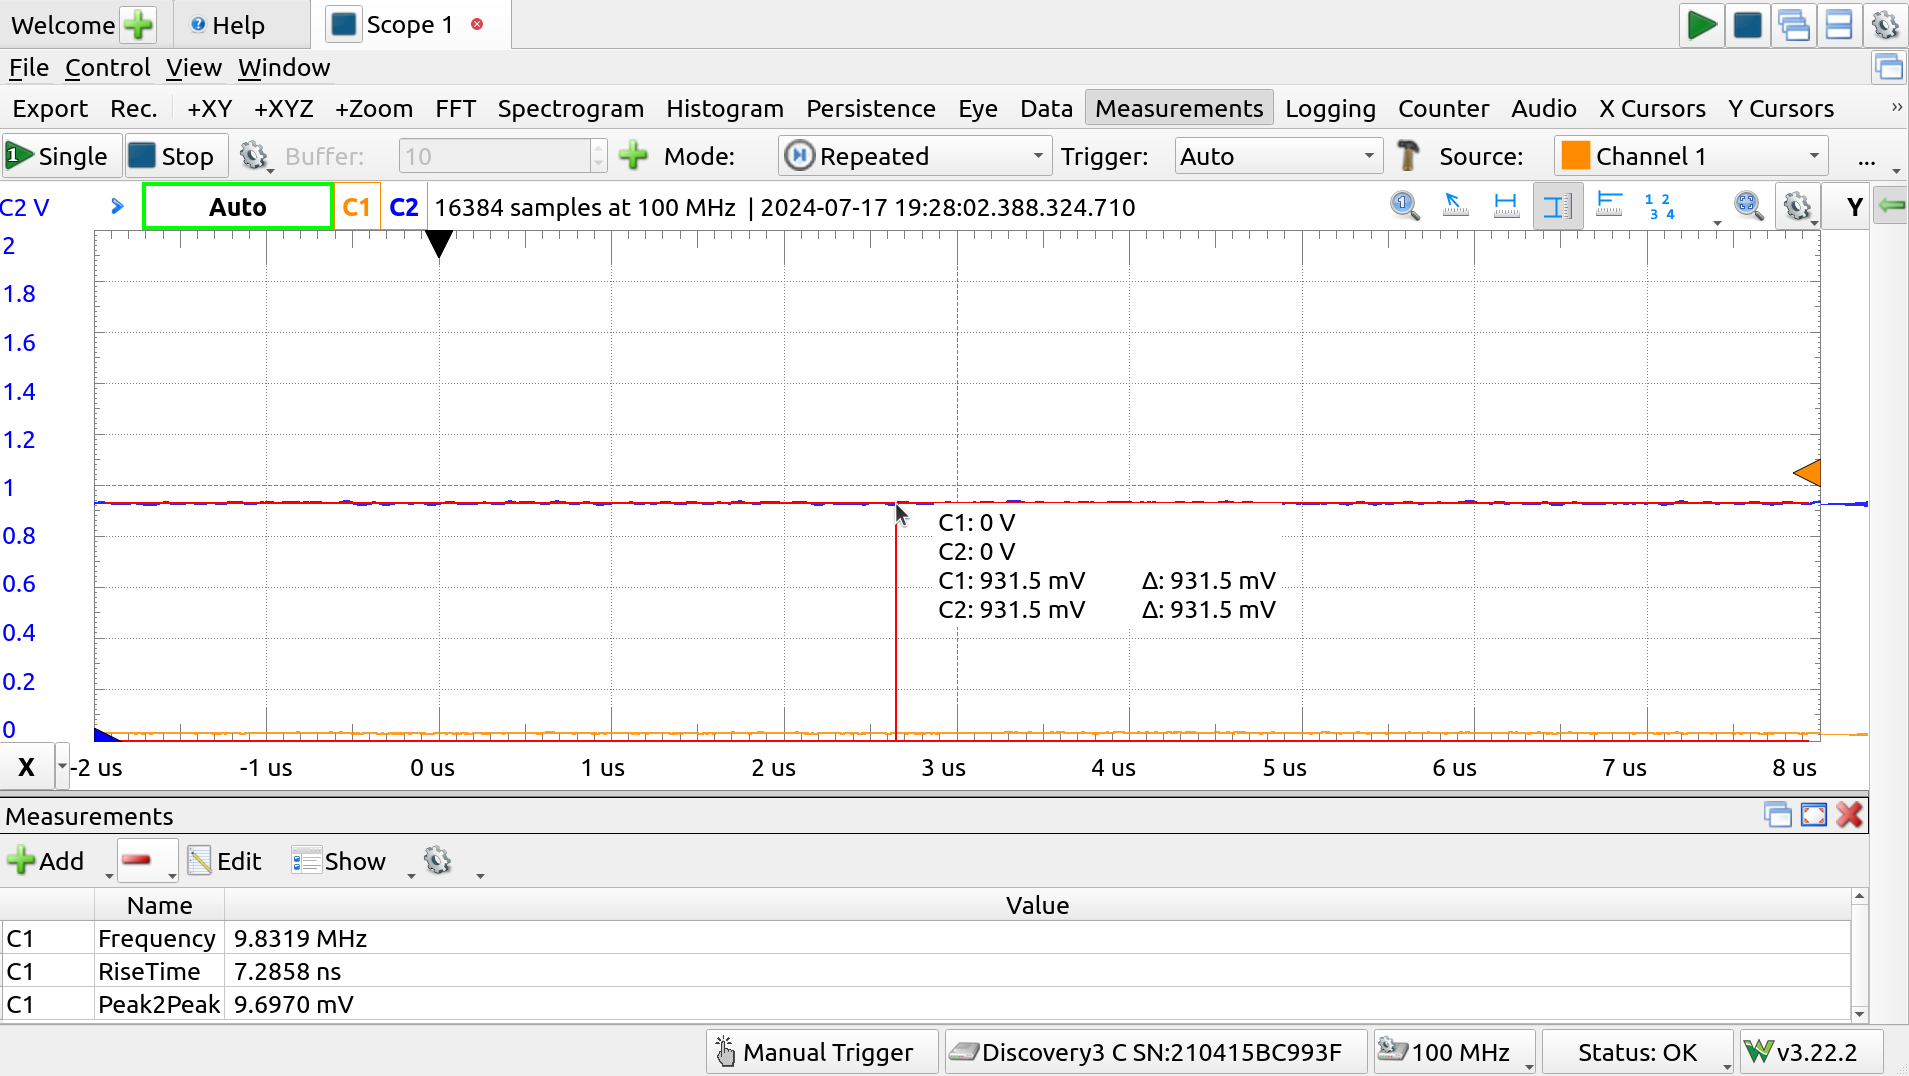
Using the “+ Add” button in Measurements, selecting Defined Measurements -> Channel 1 -> Horizontal -> Frequency Provides a real-time measurement for this value.
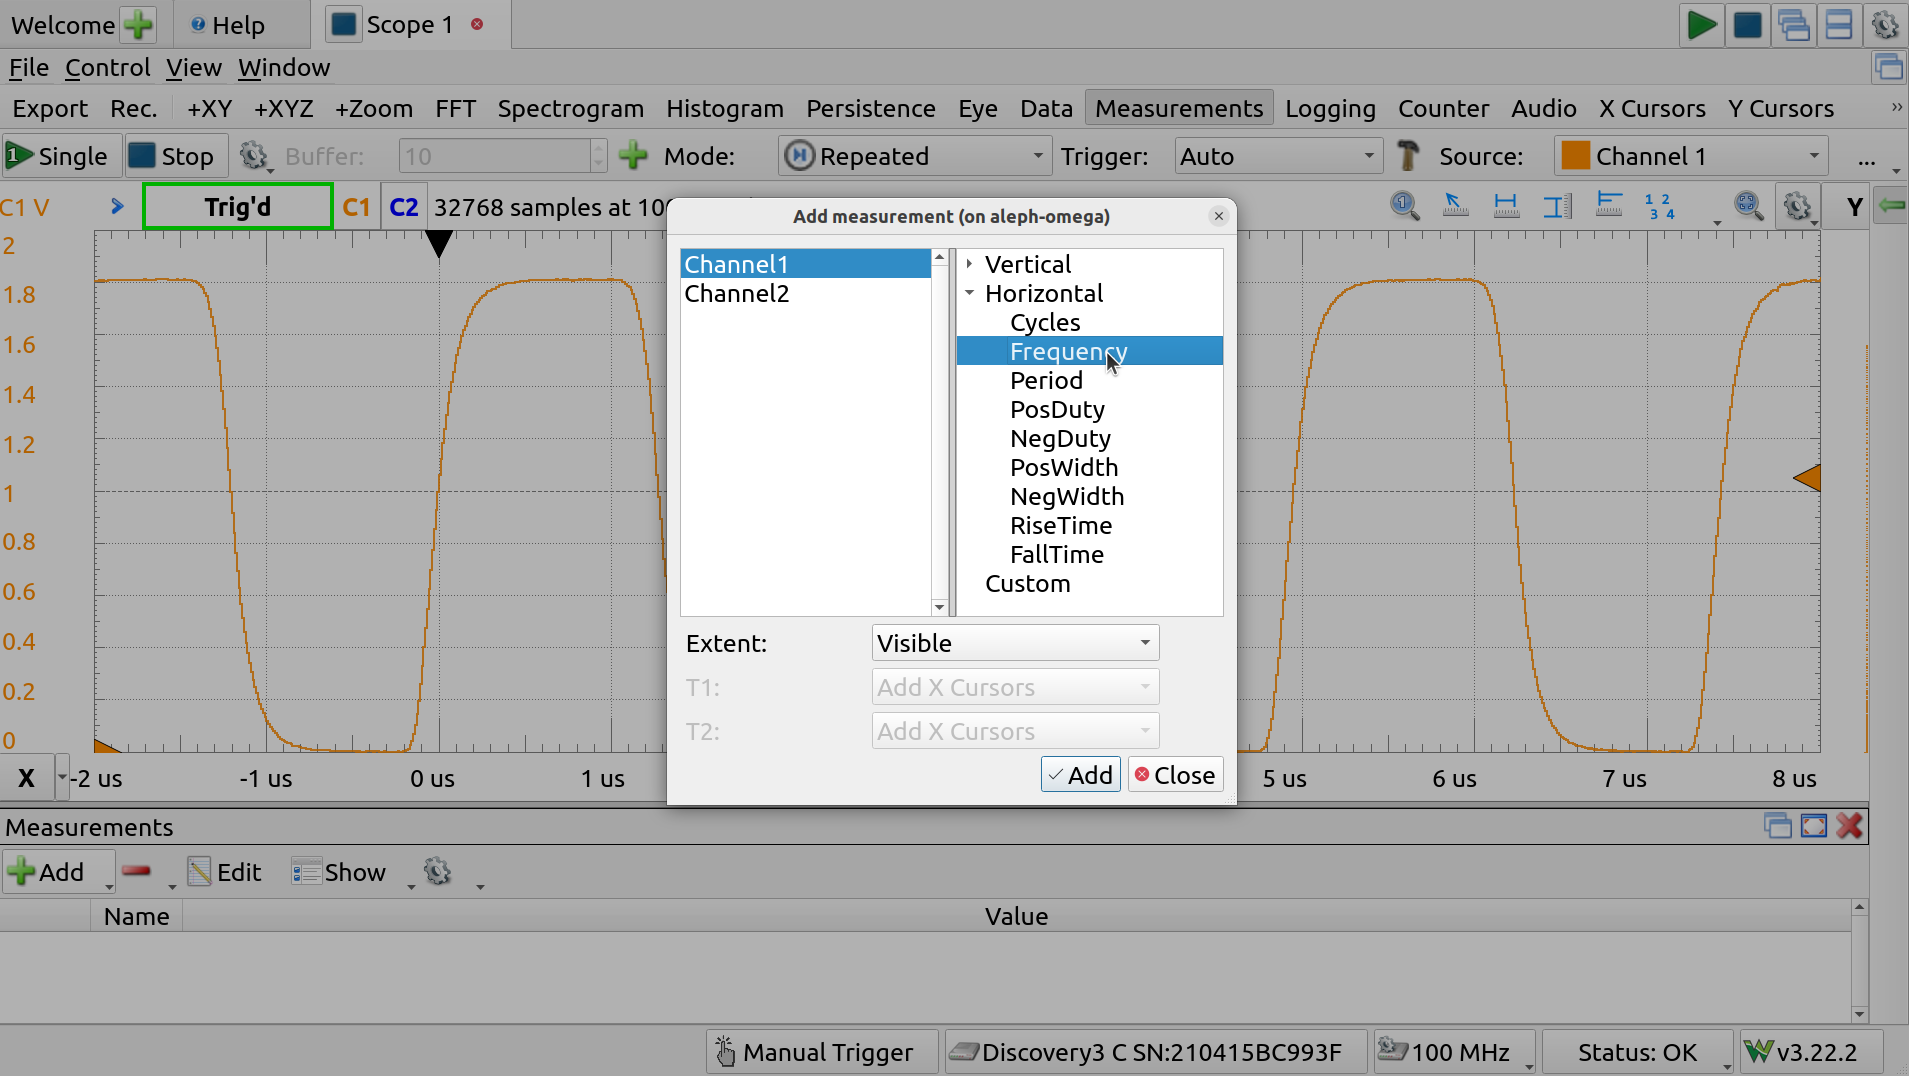
Measurements selection
Many other measurements are available.
DAC
To look at the DAC function, channel 2 can be re-enabled using the checkbox and scaled an positioned just like C1.
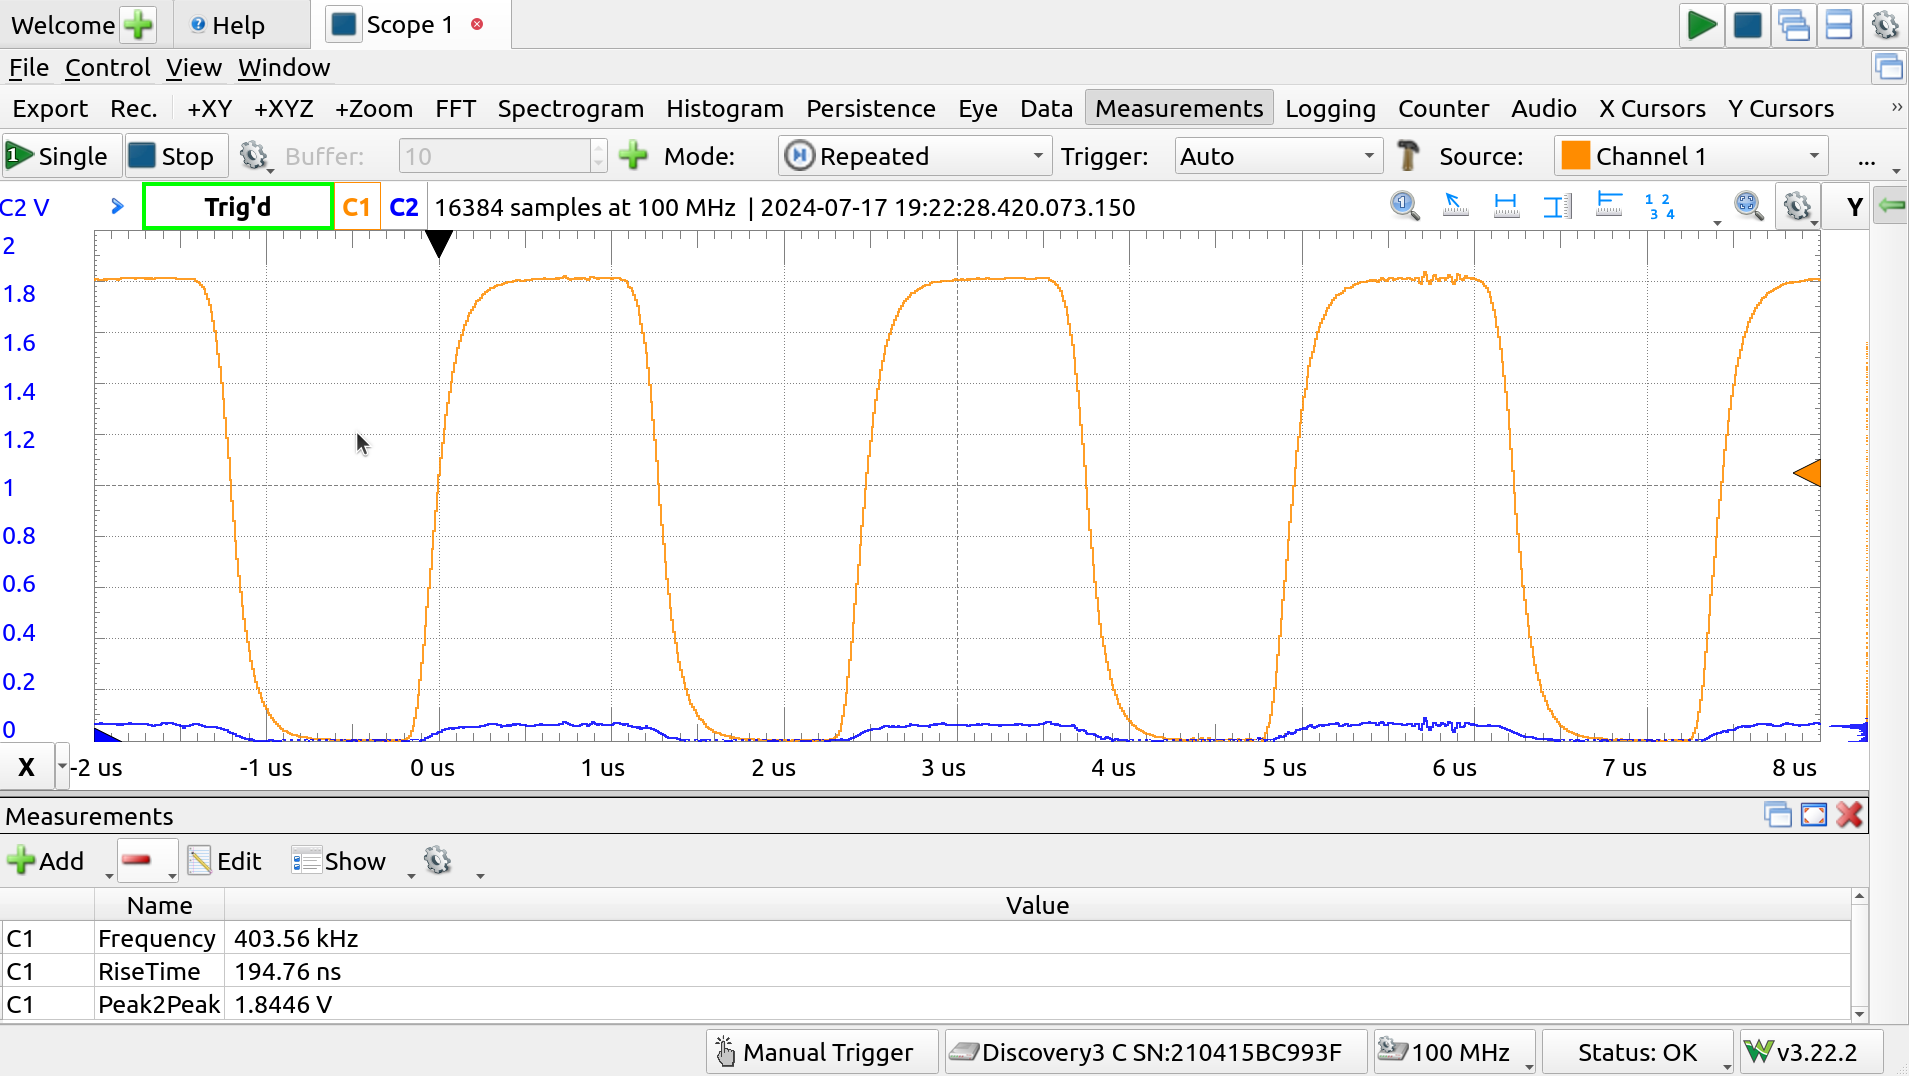
Measurements made
There’s a good deal of cross-talk, likely owing to the dangly wires used to probe the analog pins, so the ring oscillator is disabled while the DAC is enabled, by setting the in3 bit and clearing the rest, in the REPL:
>>> tt.input_byte = 1<<3
>>> print(bin(tt.input_byte))
0b1000
Enable DAC in REPL
The 3 LSBs of the input byte set the DAC output.
If we set the highest bit of the three, we should get a signal about half way up.
>>> tt.in2(1)
DAC at 100
And to get full scale, we’ll set all 3 LSBs to one, along with in[3] to keep the DAC going:
>>> tt.input_byte = 0b1111
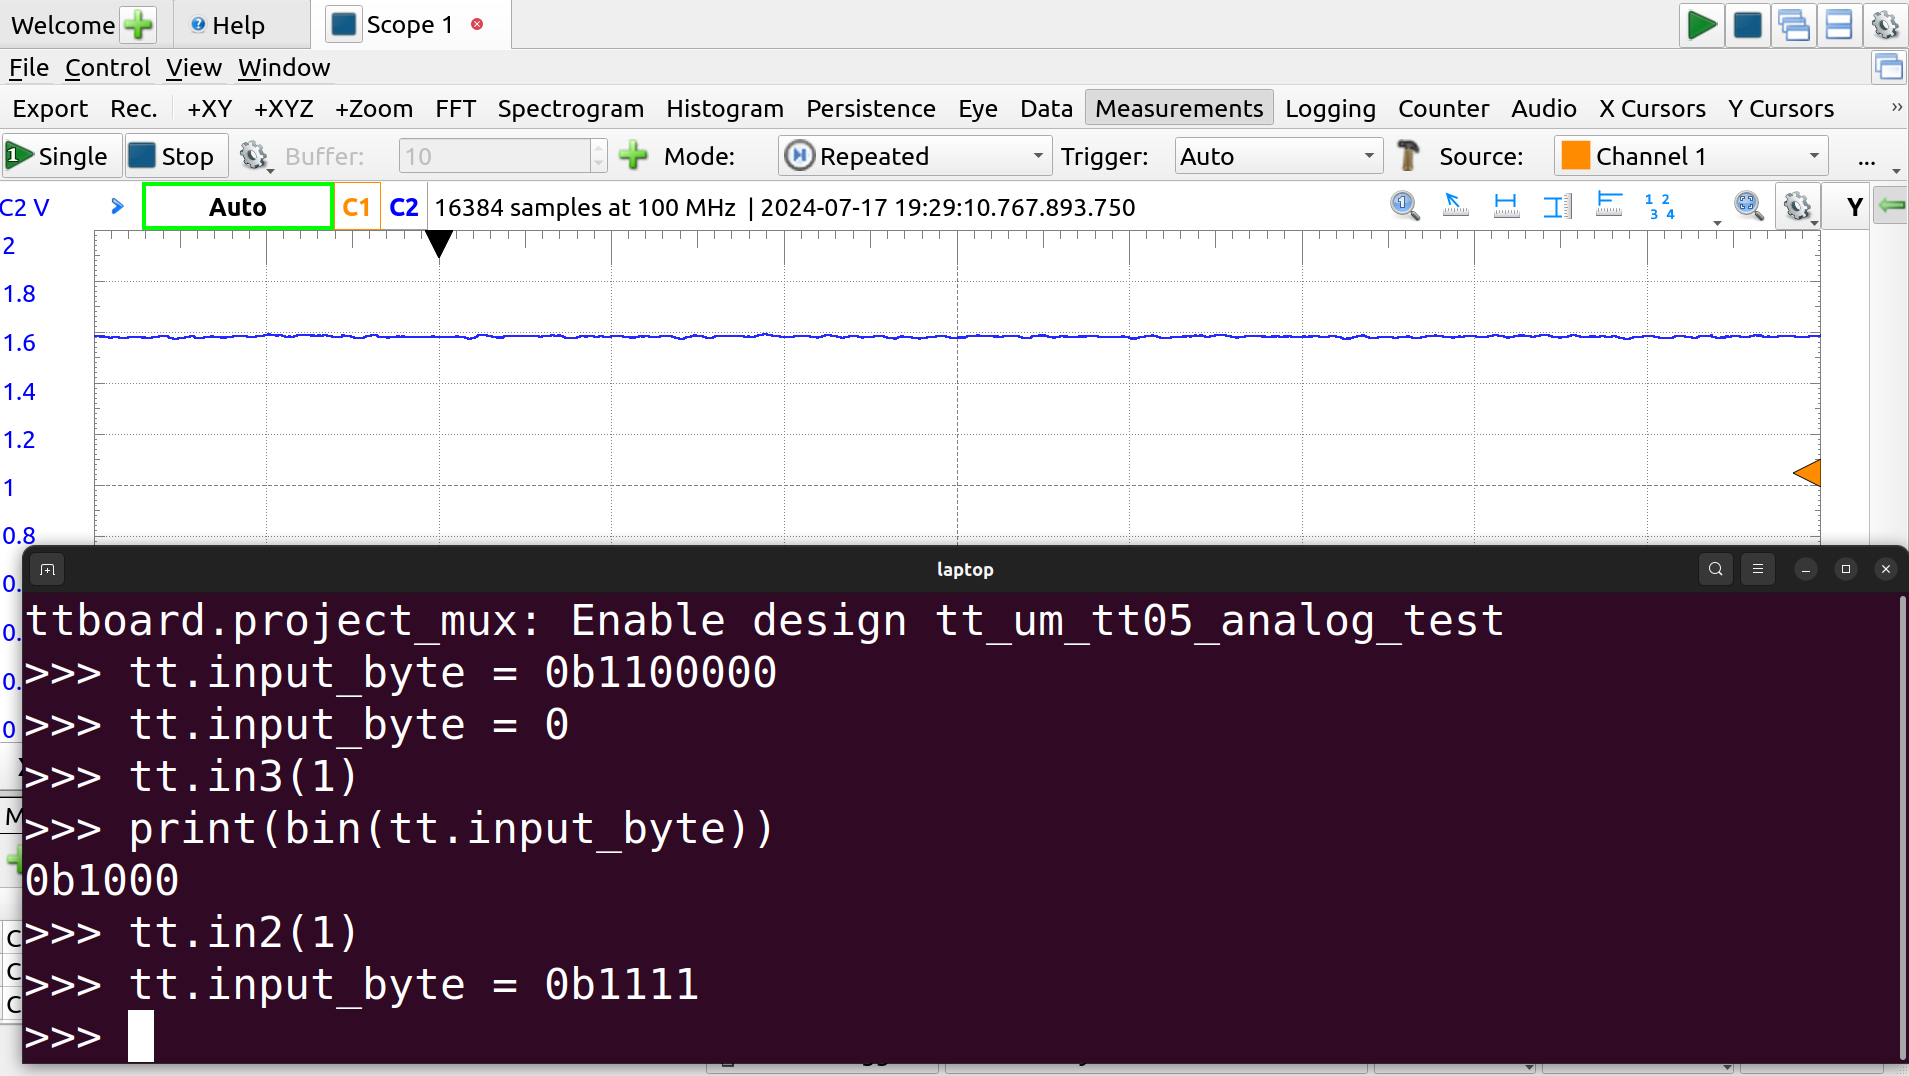
DAC at 111
Using another measurement, a Vertical -> Average on channel 2, it looks like the DAC can only make it up to just under 1.6V.
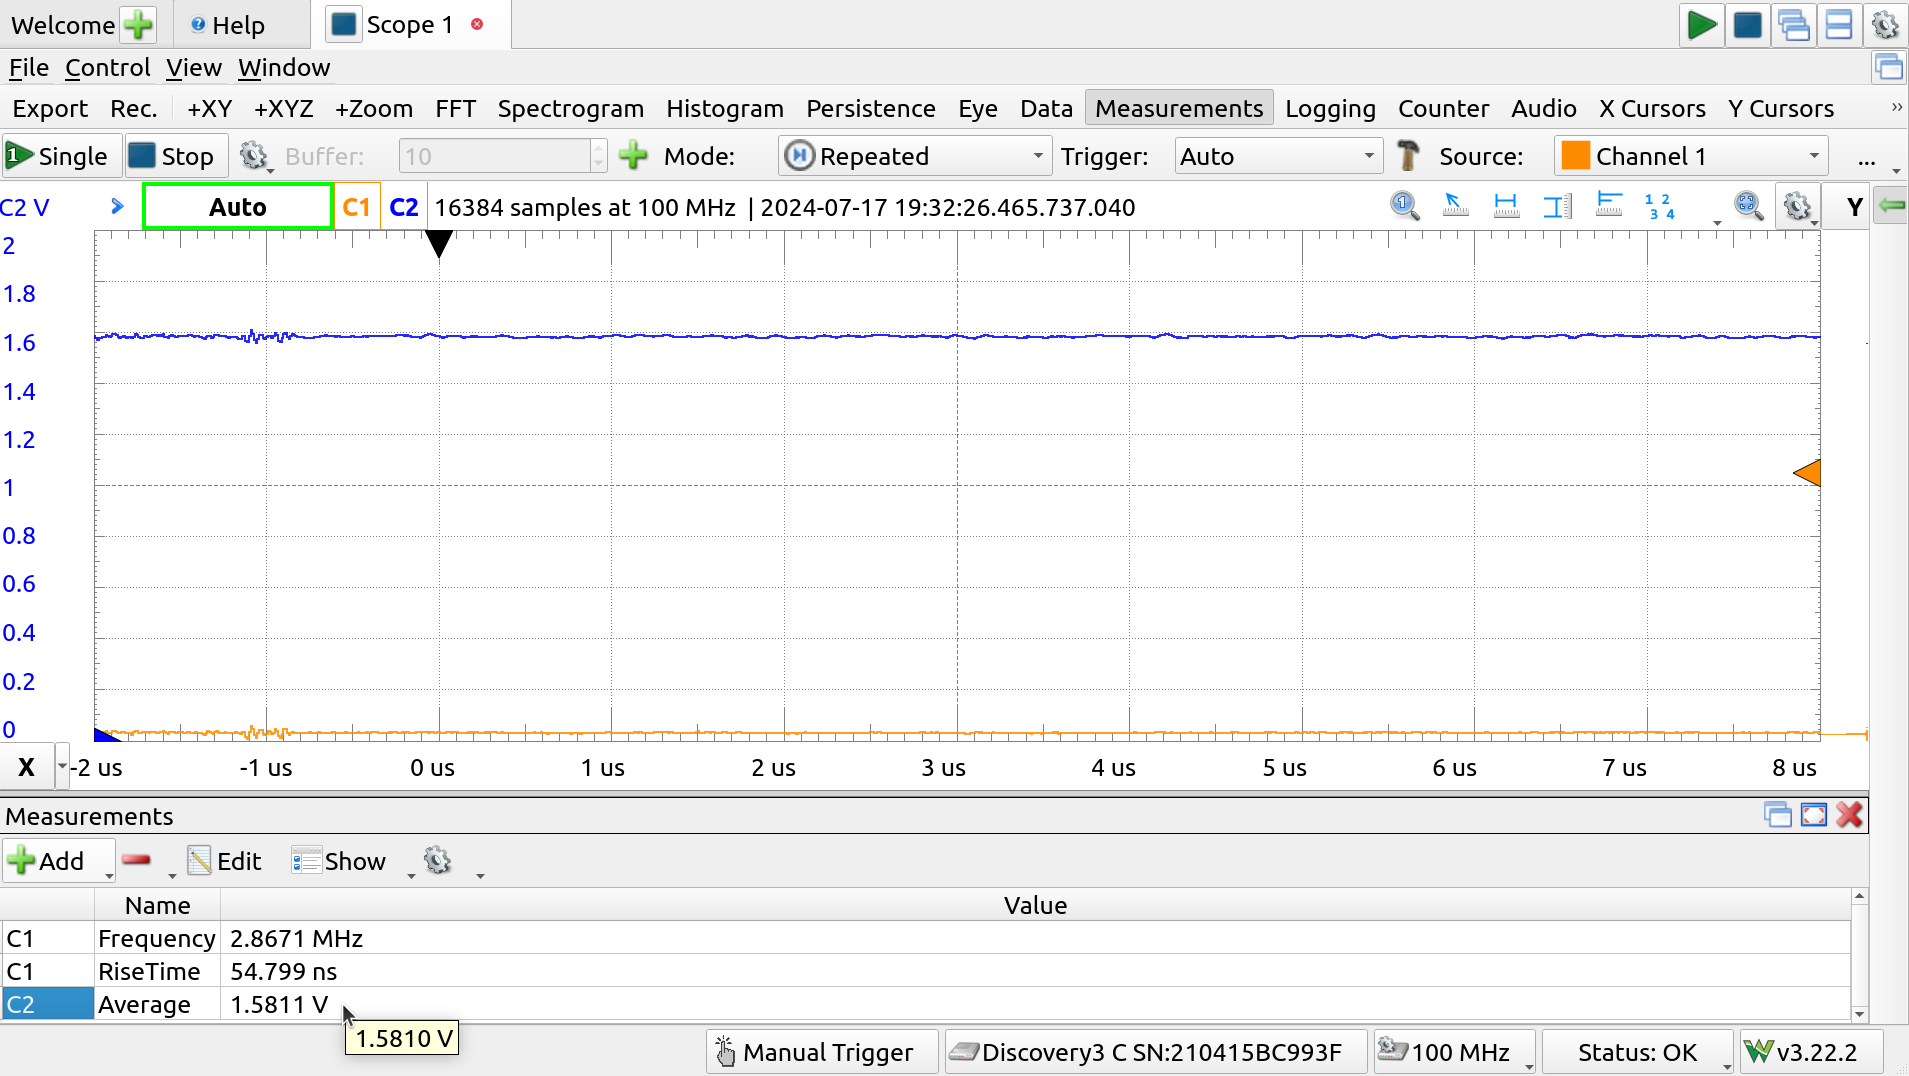
DAC max level
Digital I/O: Patterns
Doing everything manually–managing the device from the REPL on one hand and the instrument in another piece of software–works fine but for automating tasks and reproducible results, we can give control to the AD3, using the digital I/O.
In order to ensure we aren’t in conflict, with both the RP2040 and the AD3 driving any of those input pins, we set the demoboard mode to “Manual Inputs”:
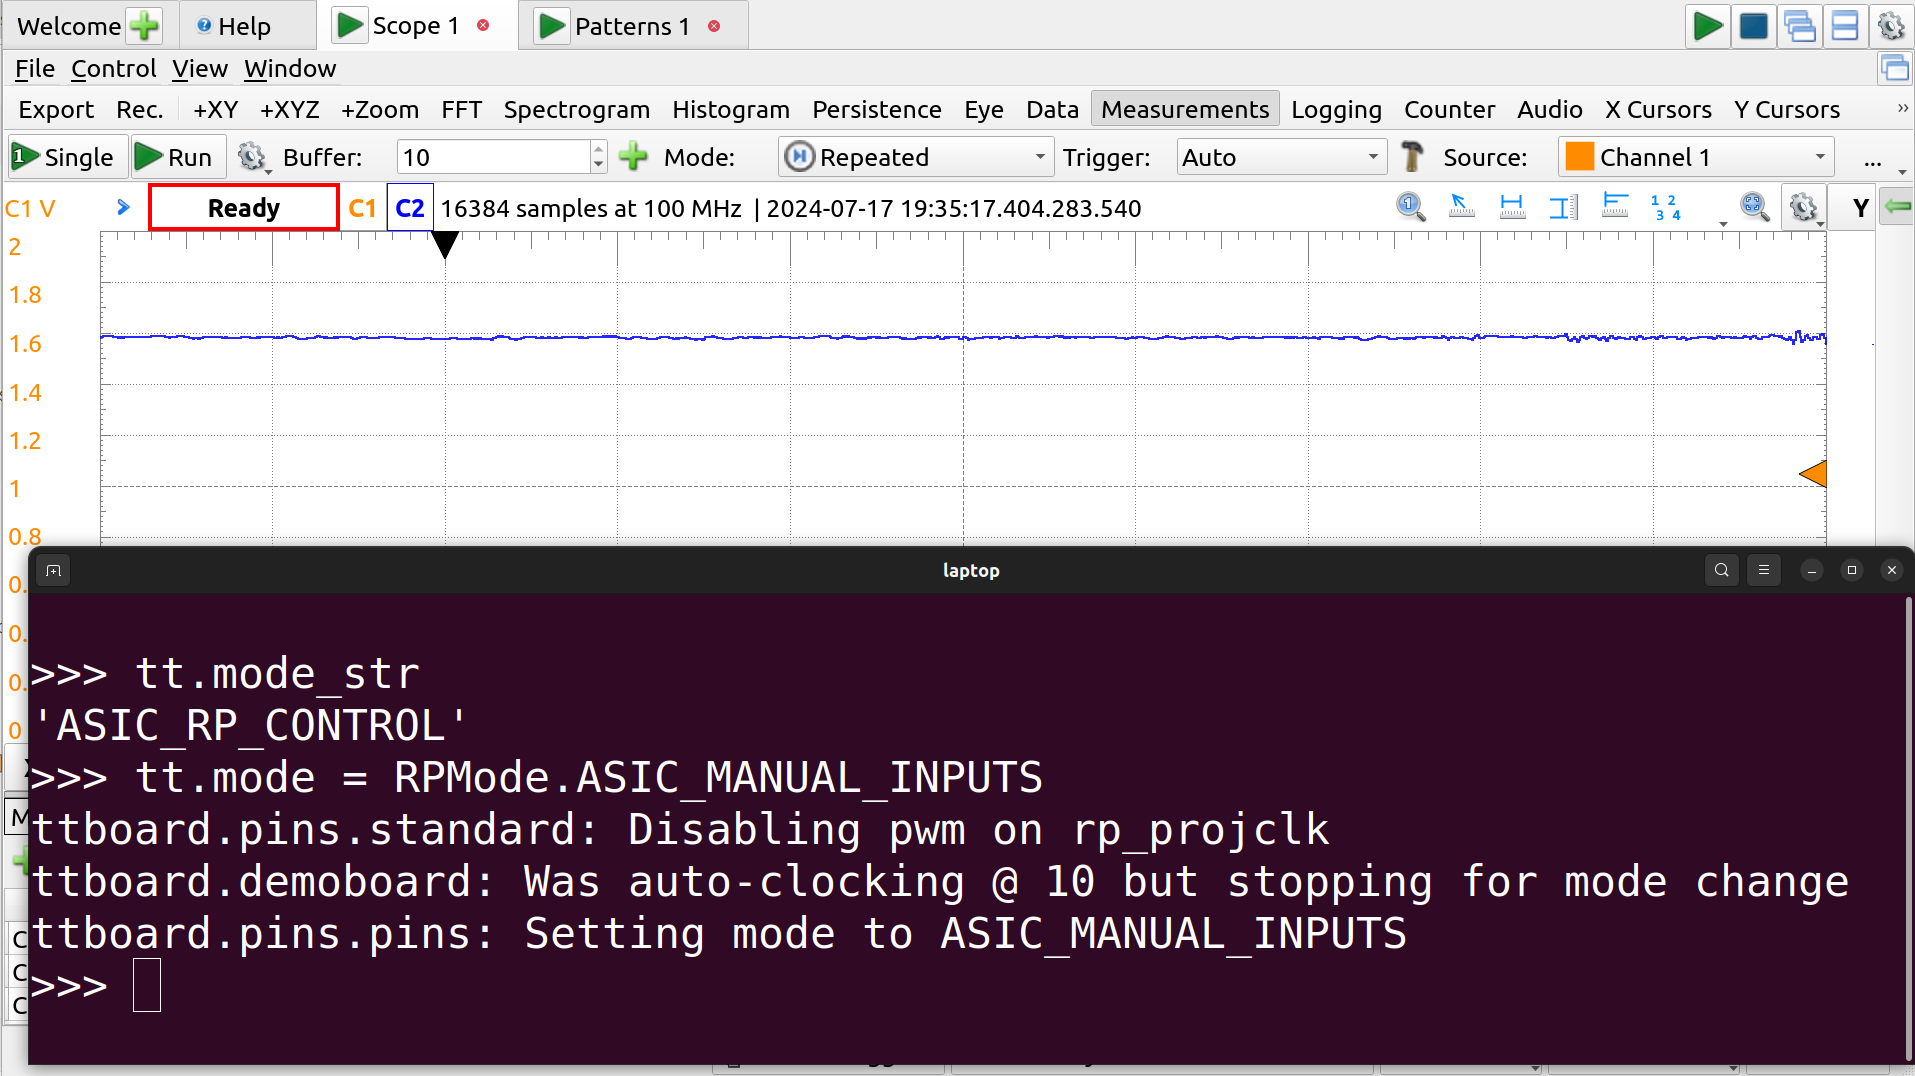
Manual inputs
>>> tt.mode_str
'ASIC_RP_CONTROL'
>>>
>>> tt.mode = RPMode.ASIC_MANUAL_INPUTS

ttboard.pins.standard: Disabling pwm on rp_projclk
ttboard.demoboard: Was auto-clocking @ 10 but stopping for mode change
ttboard.pins.pins: Setting mode to ASIC_MANUAL_INPUTS
>>>
First, we can create some named signals using the Patterns instrument. Open a Patterns interface from the Welcome tab (or using the green + on the tab itself).
Simple bit flags are signals, set as Push-Pull (PP) constants, that can be set to 0 or 1. The I/O pins specified here are on the Analog Discovery, we’ll need to wire there to the correct input pins on the demoboard PMOD header.
Create signals for DACen (DIO 3), RingOutEn (DIO 9) and RingEn (DIO 10).
The DAC has three input bits, and we can add this as a BUS using DIO 0, 1 and 2 (with 2 as the MSB). Setting it as a Number allows us to set the value of the bus to anything between 0 and 7 and have the bits set appropriately.
The specific connections were selected to make wiring simple when the AD3 is facing the demoboard, and to summarize should be wired as
AD3     Demoboard Input
0       in0
1       in1
2       in2
3       in3
9       in5
10      in6
GND     GND
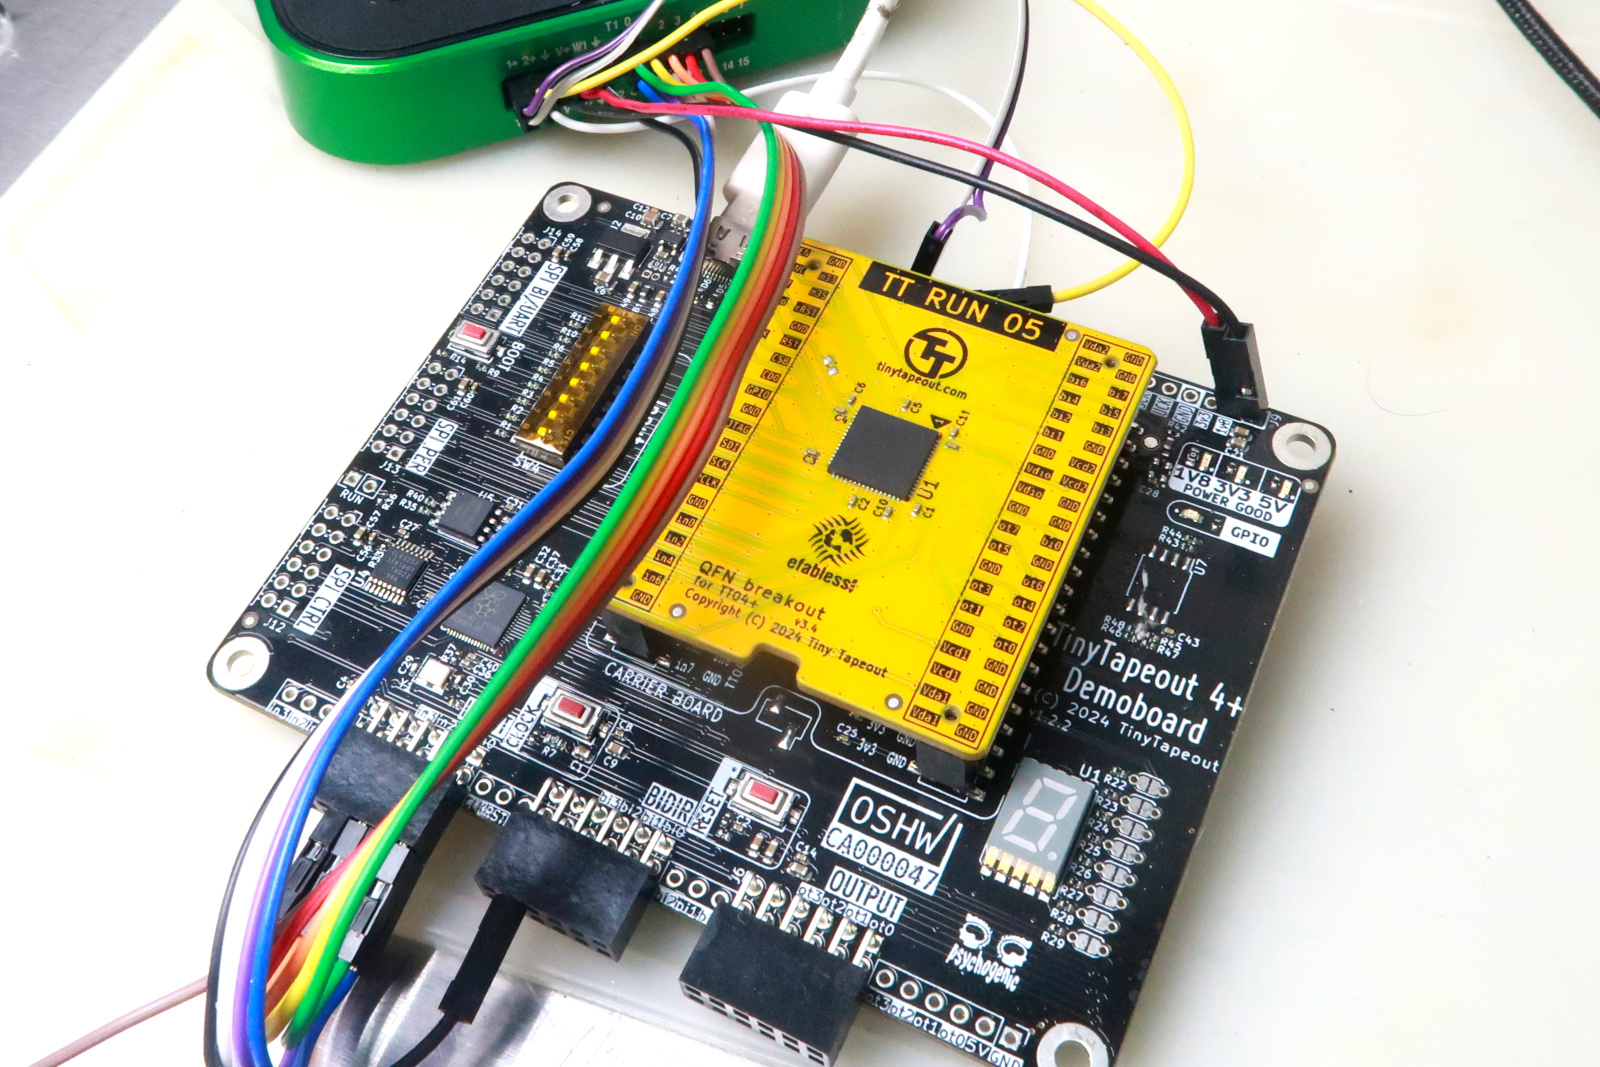
AD3 DIO and Core Supply connections
With everything wired up, setting all the signals to 1 and the DACCtrl to 7 – so all configured bits high – and pressing Run should set the bits on the input, and this may be checked by outputting the current state of the input_byte in the REPL
>>> bin(tt.input_byte)
'0b1101111'
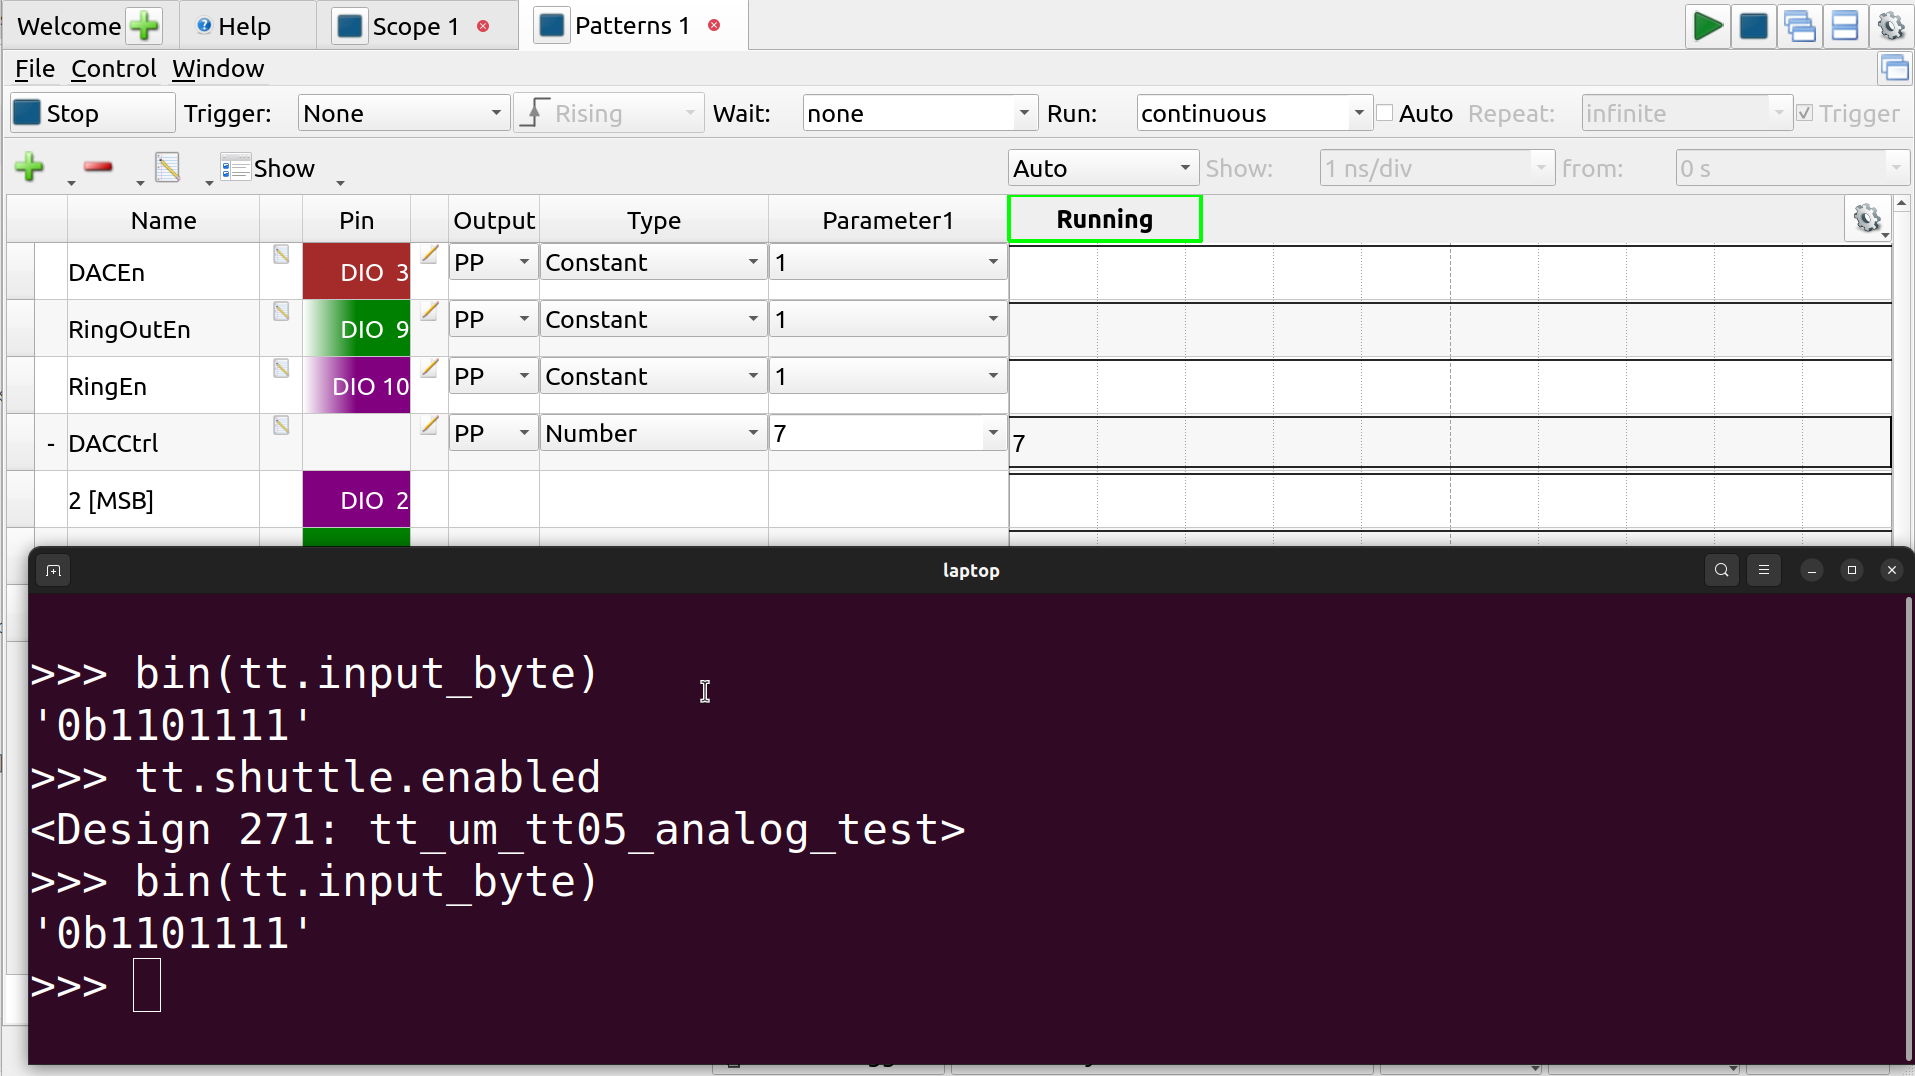
Reading AD3 DIO from demoboard
A look at the scope shows that we are now controlling things using the patterns tool signals.
You can turn the ring oscillator and DAC on and off, change the DAC value, and it is all reflected in real time.
Scripting
Now we have control of the project through the AD3, but it is still all manual.
The easiest way to automate interactions and measurements is through the scripting tool built into the Waveforms software.
The best part about this method of scripting is that the state of all the tools in all the tabs is reflected in real-time in the scripting engine.
For example, we have already created a few measurements in the scope tool: these are all available in code completion, and their values reflect the state of the system whenever the script is run.
Here’s an example of printing out the frequency measurement reading from the scope, after having run it multiple times the output looks like:
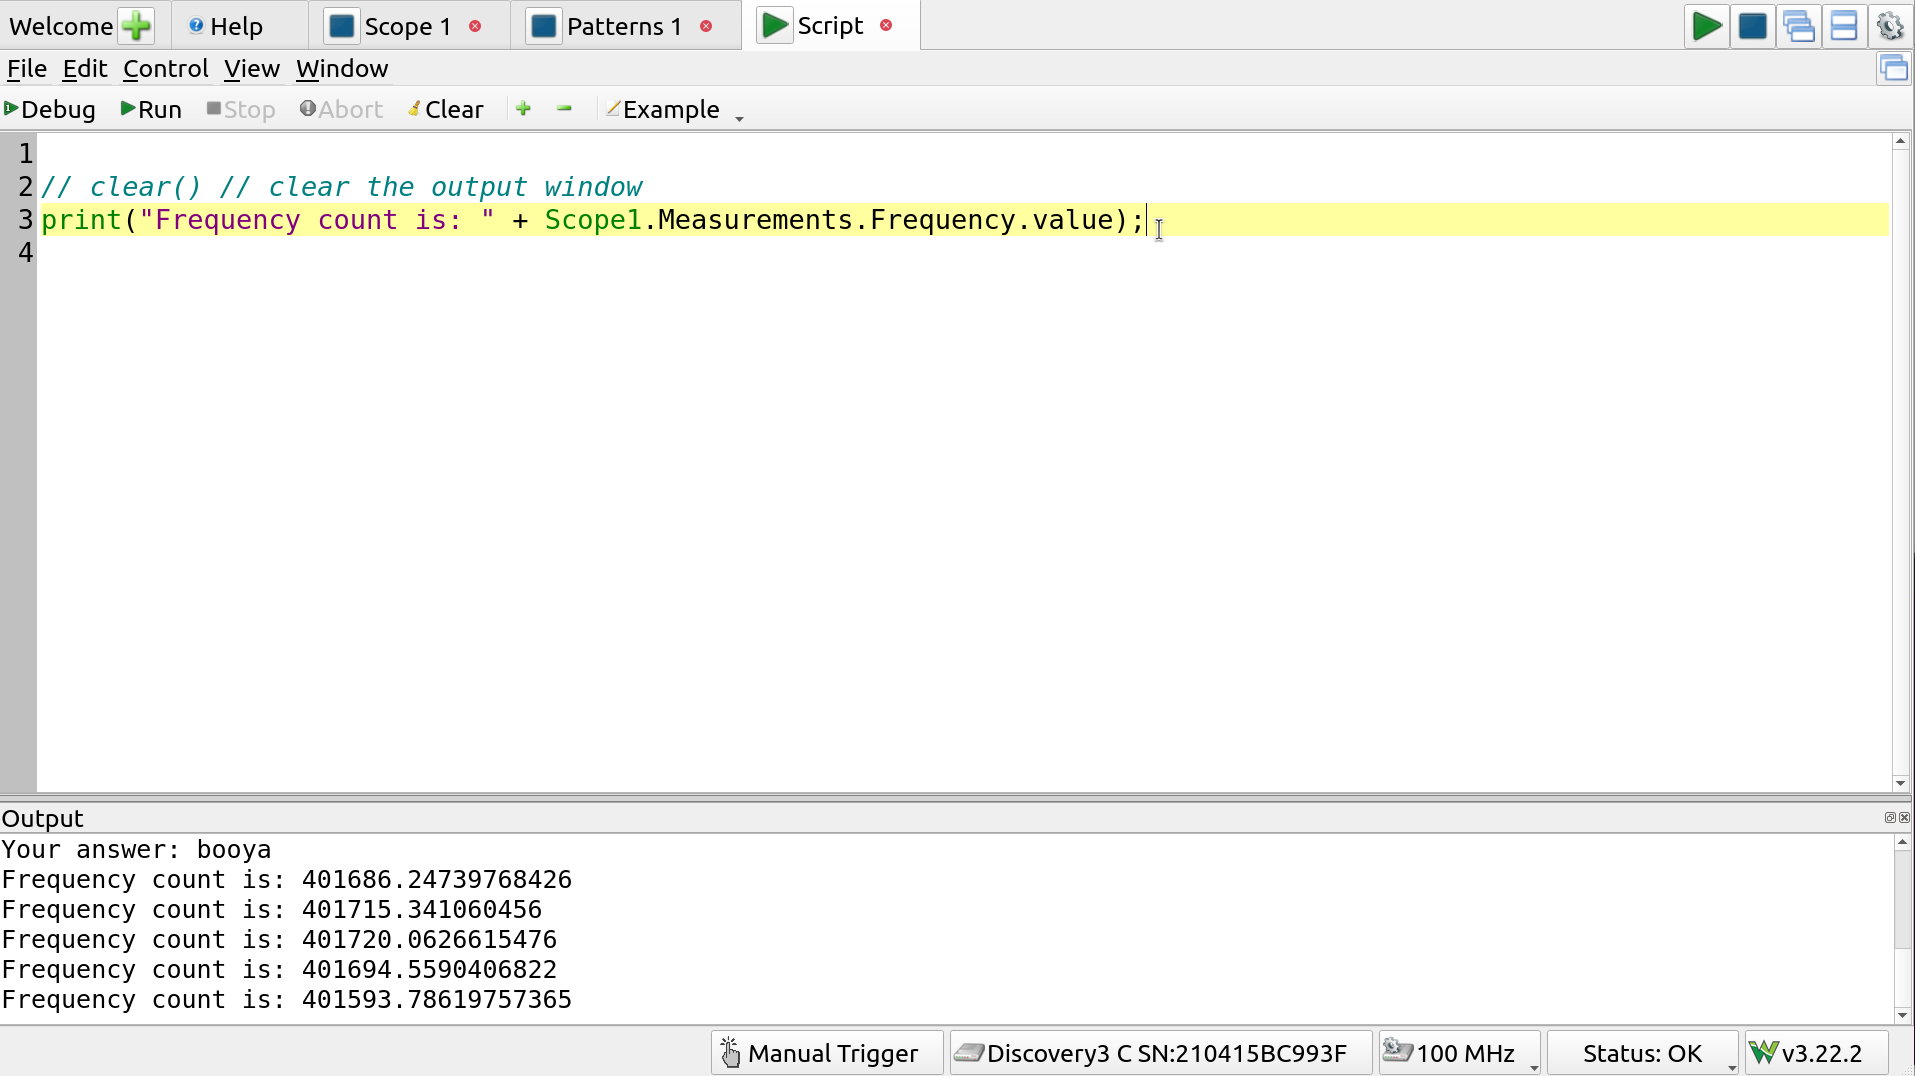
Reading frequency measurement from the scripting engine
The Scope1 is the name of the scope tab/instrument itself, and the attributes (Scope1.Measurements.Frequency.value) were simply found by exploring using the code completion.
Thus, the recommended approach is to:
- Perform all your setup using the waveform tools and GUIs, and then
- Use those instruments and measurements as needed in the script interface
The language is Javascript and the Script section in the Help tab, along with the code completion and debugger make development rather straightforward, after a bit of exploring. Nice and simple.
Controlling DIO
Readings may be made using the Scope instrument. To configure the I/O, the Patterns instrument is used.
For example here’s a function to enable or disable the ring oscillator
function RingOscEnable(do_enable) {
    set_to = 0;
    if (do_enable) {
        print("enabling Ring OSC");
        set_to = 1;
    } else {
        print("disabling Ring OSC");
    }
    Patterns1.Channels.RingOutEn.Constant.setValue(set_to);
    Patterns1.Channels.RingEn.Constant.setValue(set_to);
}
Running this won’t do anything–it’s just defining a function. But adding a:
RingOscEnable(true);
or
RingOscEnable(false);
will either enable or disable the oscillator, according to the parameter, which can be verified using the scope.
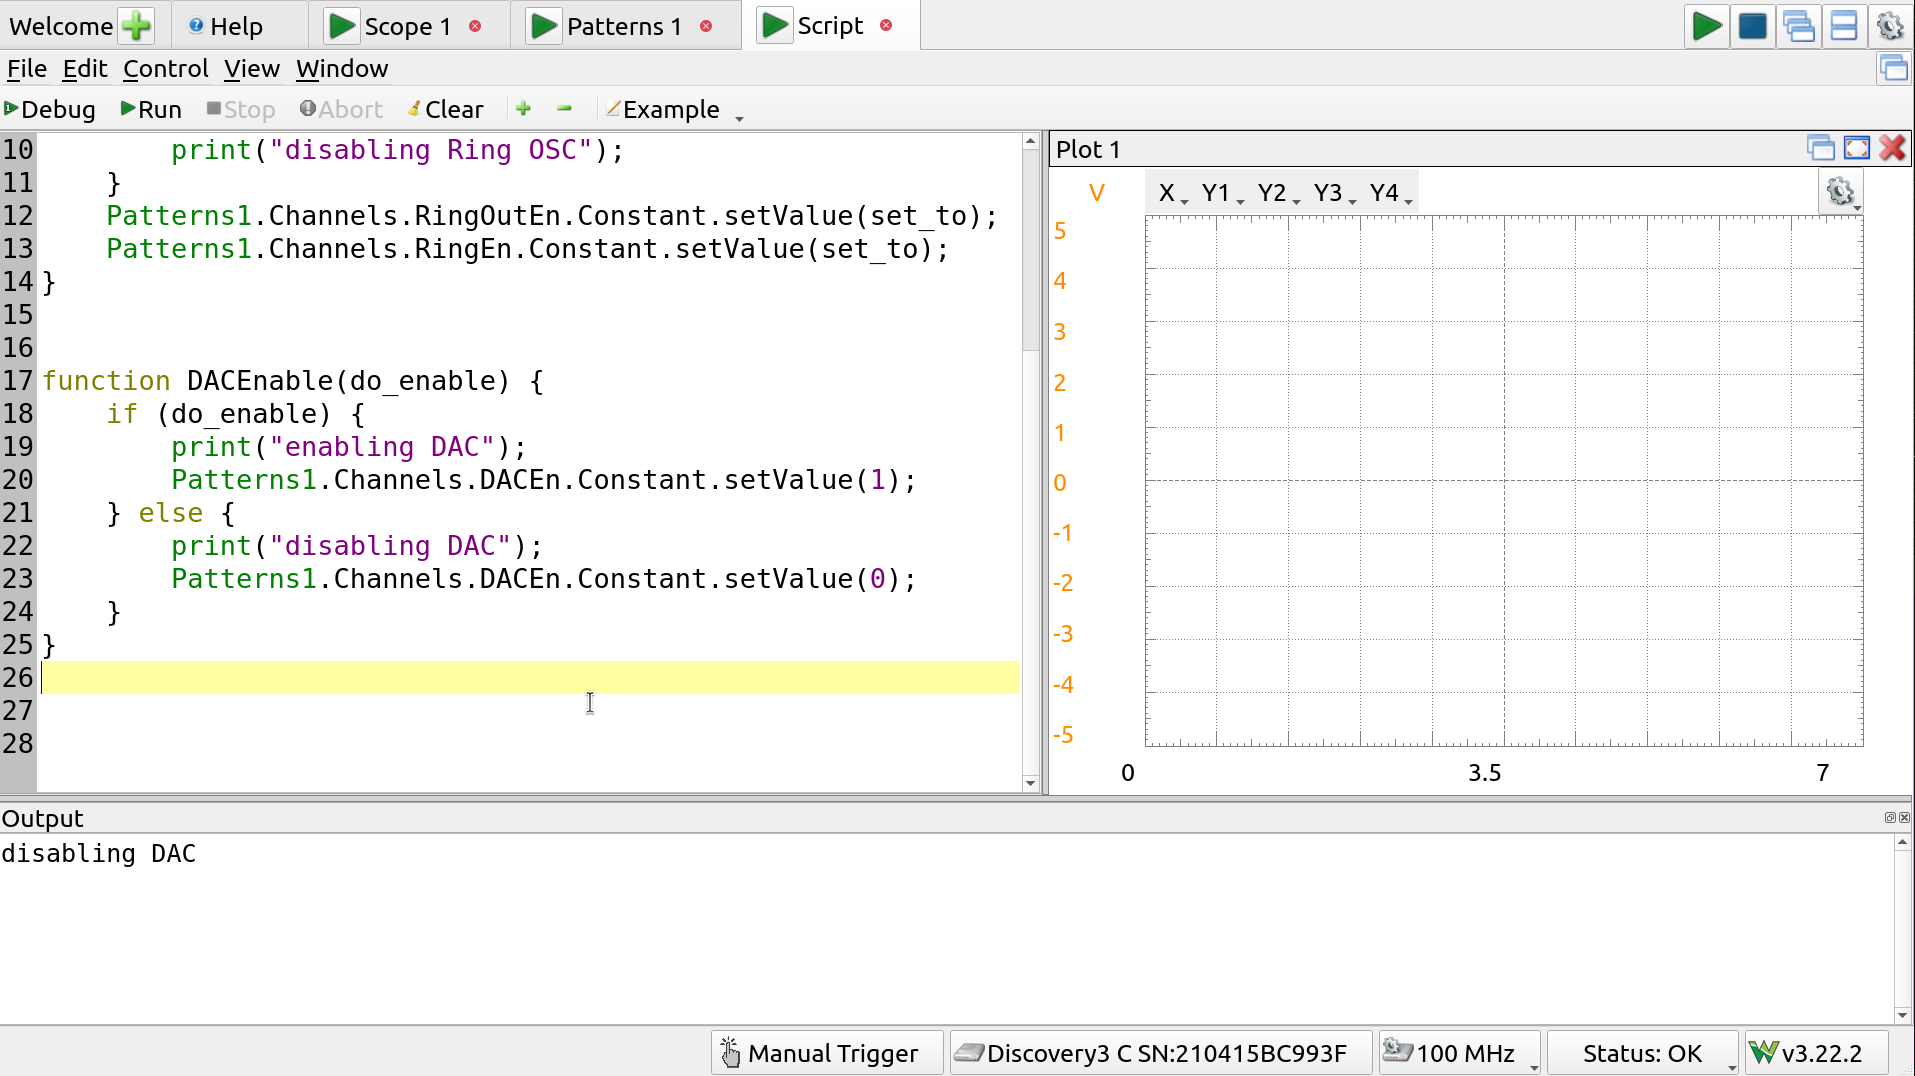
Same thing can be done for the DAC:
function DACEnable(do_enable) {
    if (do_enable) {
        print("enabling DAC");
        Patterns1.Channels.DACEn.Constant.setValue(1);
    } else {
        print("disabling DAC");
        Patterns1.Channels.DACEn.Constant.setValue(0);
    }
}
Plotting
A function may be written to iterate over all the DAC settings and collect measurements. A plot can be added for this data, from View -> Add Plot.
Scripting and plot
This plot, “plot1”, along with some utility functions are used in DACPlot():
function DACPlot() {
    // ensure we're good to go
    // the Tool.question() prompts user with GUI
    if (! Tool.question("RP2040 is in MANUAL_INPUTS mode and DAC controls are connected?")) {
        print("Aborting DAC plot");
        return 0;
    }

    // disable ring osc, and enable DAC
    RingOscEnable(false);
    DACEnable(true);
    // make sure the I/O is actually being sent
    Patterns1.run();

    // get the scope to trigger continuously
    scopeTriggerAuto();
    // ensure that instrument is running
    Scope1.run();

    // we'll hold our results in these arrays
    levels = [];
    measured = [];
    deltas = [0];
    lastMeasurement = 0;
    // set DAC to all levels between [0, 7]
    // capture using scope, get our measurement data
    for (i=0; i<8; i++) {
        print("Setting DAC to " + i + " and waiting for acquisition");
        // set that DAC value
        Patterns1.Channels.DACCtrl.Number.setValue(i);
        // trigger a single capture, and wait for it to come in
        Scope1.single();
        Scope1.wait();
        // store our collected data
        levels.push(i);
        currentDACOutput = Scope1.Measurements.Average.value;
        measured.push(currentDACOutput);
        if (lastMeasurement > 0) {
            deltas.push(currentDACOutput - lastMeasurement);
        }
        lastMeasurement = currentDACOutput;
        print("\t" + currentDACOutput + "V");
    }
    // set data on the plot
    plot1.X.data = levels;
    plot1.Y1.data = measured;
    plot1.Y2.data = deltas;

    // turn off all instruments
    allOff();

    // do some data processing and output
    stepTotal = 0;
    for (i=1; i<8; i++) {
        stepTotal += deltas[i];
    }
    voltsPerBit = stepTotal / 7.0;

    print("difference between subsequent levels: \n" + plot1.Y2.data);

    print("Average bit voltage step: " + voltsPerBit + "V");
    print("Full scale: " + measured[0] + "V - " + measured[7] + "V ( " +
            (measured[7] - measured[0]) + "V range)");

    return voltsPerBit;

}
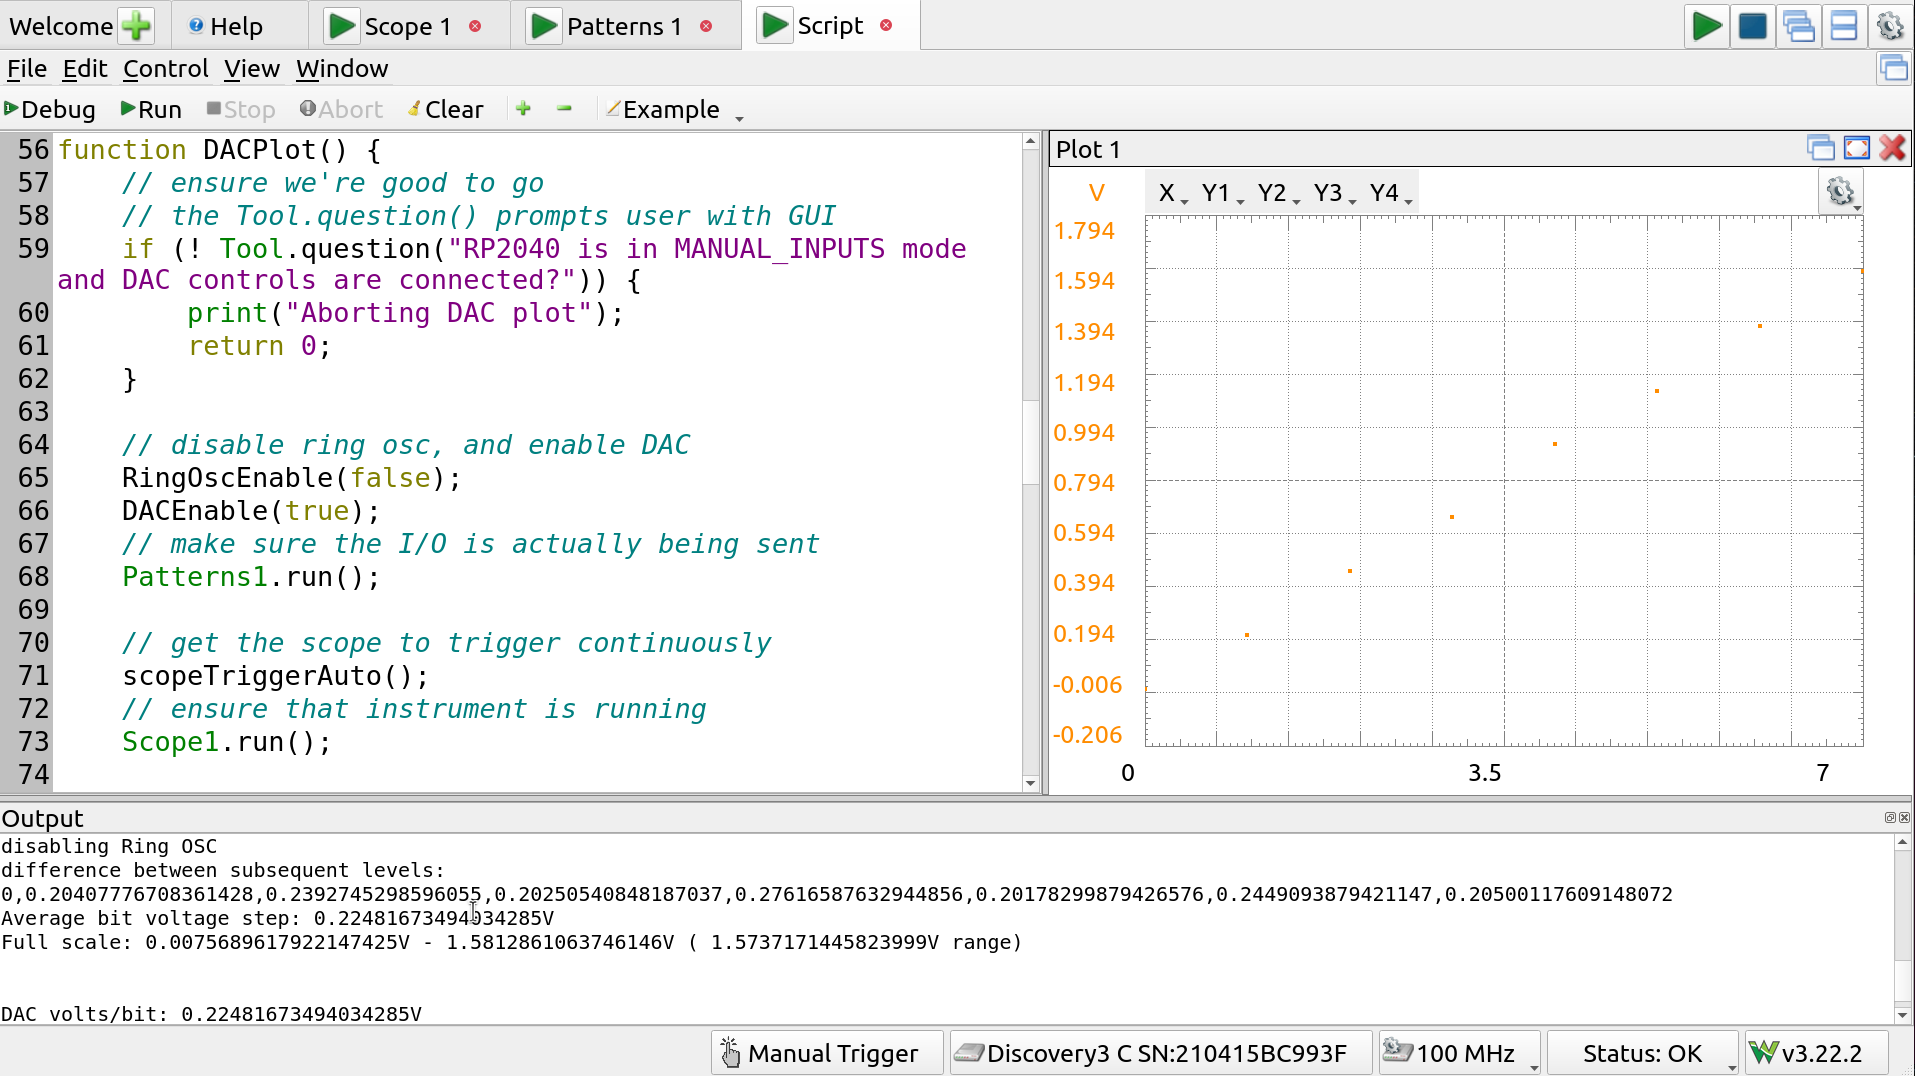
DAC Plot
Results show that, though there is some jitter in the steps, the DAC appears relatively linear adding about 0.23V per step, with a full scale range of about 1.6V.
Measuring the ring oscillator supply voltage dependence
The ring oscillator frequency is sensitive to both temperature and supply voltage.
We can feed in the core voltage from the AD3’s positive supply, which may be controlled manually or via script. For this,
- The jumper in position F2 on the demoboard (top left, near voltage regulators) is removed; and
- AD3 V+ is connected to 1v8 supply pin on demoboard top header
The core supply voltage may now be controlled using these functions:
    function CoreSupplyEnable(do_enable) {
        // core supply will be provided with the
        // positive output
        if (do_enable) {
            print("Enabling core supply");
            setCoreVoltage(1.8);
            Supplies.Output.PositiveSupply.Enable.setValue(1);
            Supplies.Output.NegativeSupply.Enable.setValue(0);
            Supplies.run();
        } else {
            print("Disabling core supply");
            Supplies.Output.PositiveSupply.Enable.setValue(0);
            Supplies.stop();
        }
    }

    function setCoreVoltage(toV) {
        // we only accept to set this voltage to
        // 1v8 +/- 0.1V
        if ( (toV < 1.70) || (toV > 1.90)) {
            print("Refusing to set core voltage to " + toV );
            return;
        }
        print("Core: " + toV + "V");
        Supplies.Output.PositiveSupply.Voltage.setValue(toV);
    }
So now we need only:
- Enable the ring oscillator,
- Set the core voltage,
- Use the scope to acquire,
- Gather the frequency measurement data, and
- Increment to next core voltage and loop.
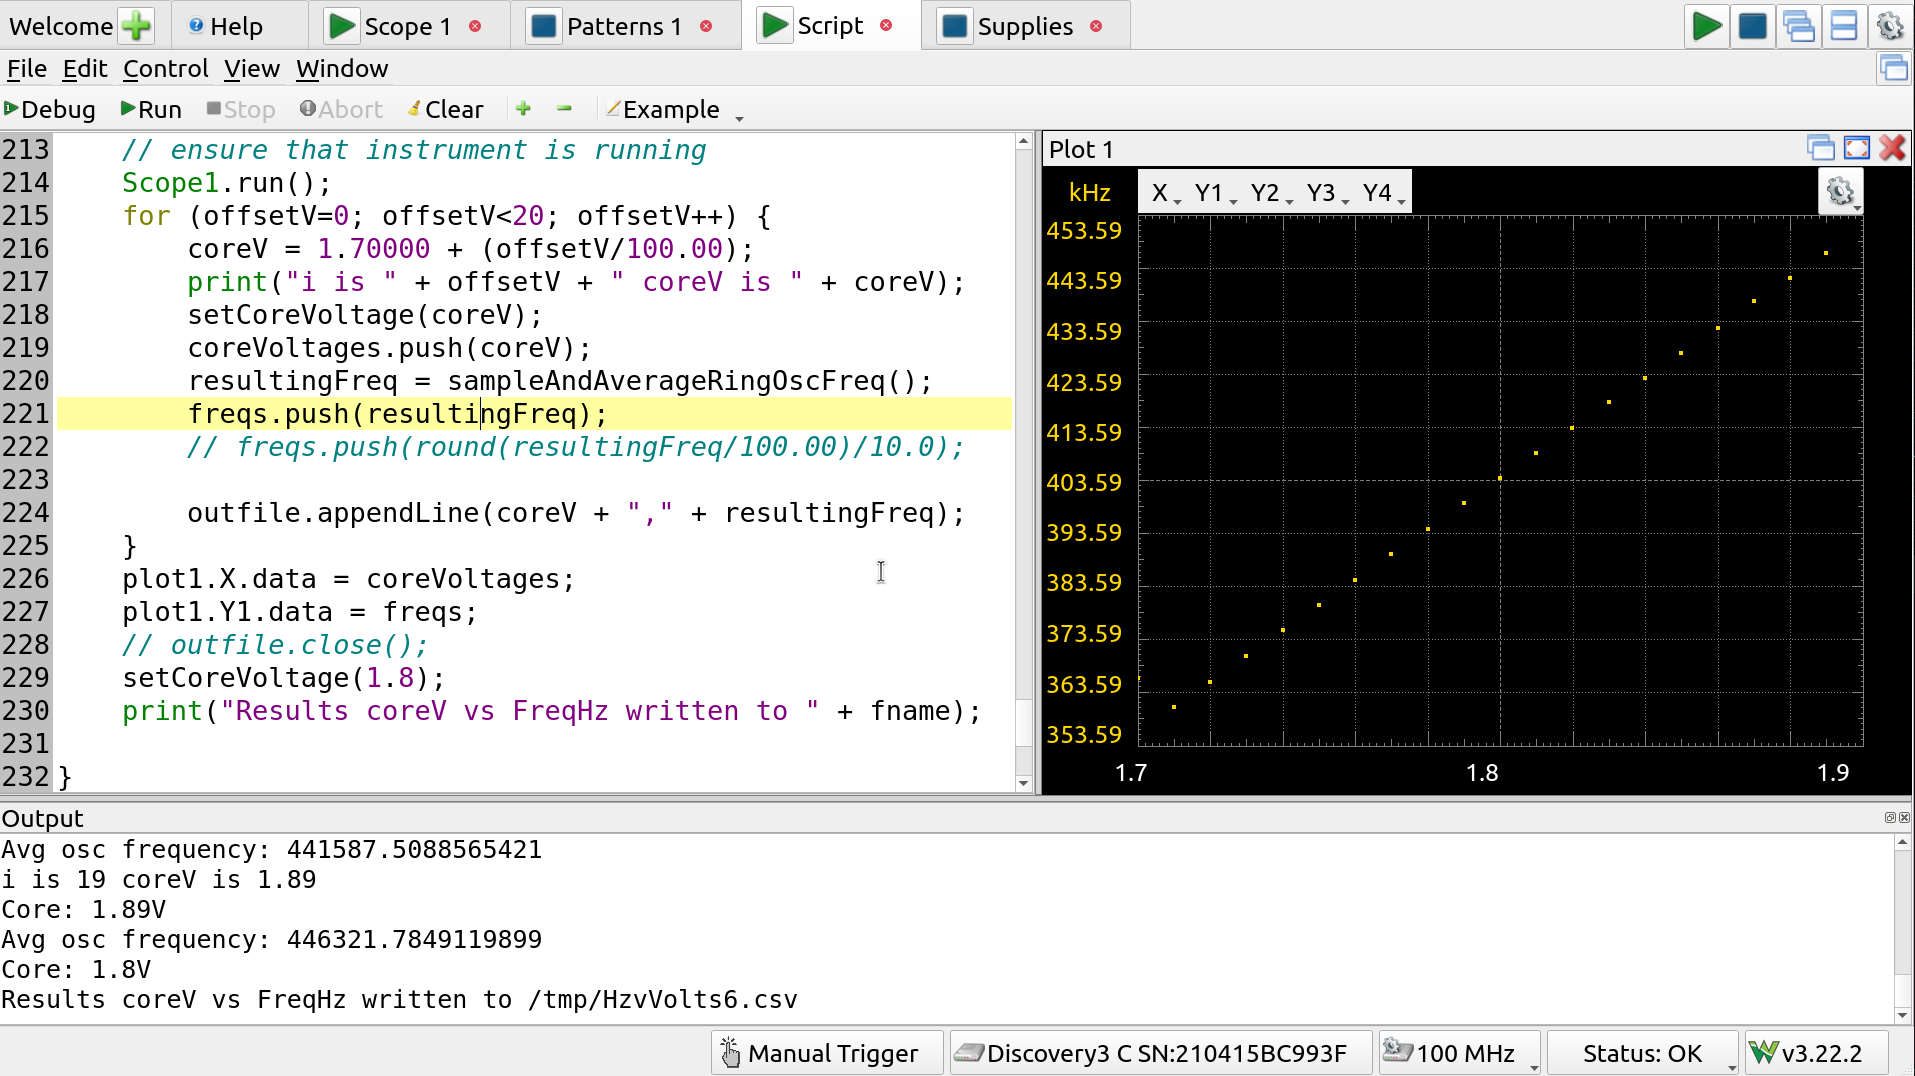
Characterizing frequency vs core V
One noteworthy thing is that we should ensure the core remains powered after doing project selection on the demoboard so, after removing the F2 0R jumper, and connecting V+ to the 1v8 input on the demoboard top header:
- Enable the supply in the Supplies tab, at 1v8, using the Master Enable,
- Select the project anew, using REPL or commander app,
- Keep the V+ supply powered
Another thing to note is that having the inputs driven during the demoboard’s RP2040 boot up will interfere with reading the chip ROM on the ASIC and may confuse the system. To avoid this, DIO should either be disconnected or tri-stated.
It is possible to configure the Patterns signals to tri-stated but this isn’t exactly pretty code (it uses non-obvious indices for channel output values): see the powerupHighZ script in the workspace for details.
Main test script
For reference, here is the test script used, in its entirety.
/*
*
*  This is both a testbench for the analog project
*  no TinyTapeout05 and a sample of using the AD3
*  to perform automated tests and data collection.
*  For more information on the instruments and
*  scripting engine, see the decently ok online help
*  in this very program.
*
*  To just use the o'scope, spectrum analyzer etc, only
*  the "Scope probes" section, below, need be connected.
*  However, enabling the project and configuring it will
*  need to happen via the SDK (REPL serial terminal) or
*  the commander app.
*
*  For the automated tests here, we also need the
*  Core Voltage Supply" connected for the freq vs V
*  test (with F2 removed), and the digital
*  I/O for both the freq vs V and the DAC test.
*
*  Usage: just connect things up as described below and
*  run the script, it will prompt you for
*  what it needs and filenames for output CSVs (just
*  cancel to skip writing those files).
*
*  (C) 2024 Pat Deegan, https://psychogenic.com
*/

/*
    HOOKUP GUIDE -- connect these from the AD3
    to the demoboard to enable all tests.


    Scope probes:
    AD3    Demoboard top header
    ============================
    1+     m33 (ring osc ouput)
    1-     GND
    2+     m35 (DAC output)
    2-     GND


    Digital I/O control:
    AD3     Demoboard Input
    ============================
    0       in0
    1       in1
    2       in2
    3       in3
    9       in5
    10      in6
    GND     GND

    Core Voltage Supply:
    NOTE NOTE NOTE: the F2 jumper must be REMOVED from
    the board prior to doing this!

    AD3    Demoboard top header
    ============================
    V+      1v8  (danger: remove F2!)
    GND     GND

*/


function RingOscEnable(do_enable) {
    set_to = 0;
    if (do_enable) {
        print("enabling Ring OSC");
        set_to = 1;
    } else {
        print("disabling Ring OSC");
    }
    Patterns1.Channels.RingOutEn.Constant.setValue(set_to);
    Patterns1.Channels.RingEn.Constant.setValue(set_to);
}


function DACEnable(do_enable) {
    if (do_enable) {
        print("enabling DAC");
        Patterns1.Channels.DACEn.Constant.setValue(1);
    } else {
        print("disabling DAC");
        Patterns1.Channels.DACEn.Constant.setValue(0);
    }
}


function allOff() {
    // Turn everything off
    Patterns1.run();
    DACEnable(false);
    RingOscEnable(false);
    setCoreVoltage(1.75);
    Scope1.stop();
    Patterns1.stop();
}

function CoreSupplyEnable(do_enable) {
    // core supply will be provided with the
    // positive output
    if (do_enable) {
        print("Enabling core supply");
        setCoreVoltage(1.8);
        Supplies.Output.PositiveSupply.Enable.setValue(1);
        Supplies.Output.NegativeSupply.Enable.setValue(0);
        Supplies.run();
    } else {
        print("Disabling core supply");
        Supplies.Output.PositiveSupply.Enable.setValue(0);
        Supplies.stop();
    }
}

function setCoreVoltage(toV) {
    // we only accept to set this voltage to
    // 1v8 +/- 0.1V
    if ( (toV < 1.70) || (toV > 1.90)) {
        print("Refusing to set core voltage to " + toV );
        return;
    }
    Supplies.Output.PositiveSupply.Voltage.setValue(toV);
    print("Core: " + toV + "V");
}


function scopeTriggerAuto() {
    /* utility method to remember that auto/continuous mode is '1' */
    Scope1.Trigger.Trigger.value = 1;
}
function scopeTriggerNormal() {

    /* utility method to remember that normal mode is '2' */
    Scope1.Trigger.Trigger.value = 2;
}


function DACPlot() {
    // ensure we're good to go
    // the Tool.question() prompts user with GUI
    if (! Tool.question("Run DAC plot test?")) {
        print("Aborting DAC plot");
        return 0;
    }


    // disable ring osc, and enable DAC
    RingOscEnable(false);
    DACEnable(true);
    // make sure the I/O is actually being sent
    Patterns1.run();

    // get the scope to trigger continuously
    scopeTriggerAuto();
    // ensure that instrument is running
    Scope1.run();

    // we'll hold our results in these arrays
    var levels = [];
    var measured = [];
    var deltas = [0];
    var lastMeasurement = 0;
    // set DAC to all levels between [0, 7]
    // capture using scope, get our measurement data
    for (var i=0; i<8; i++) {
        print("Setting DAC to " + i + " and waiting for acquisition");
        // set that DAC value
        Patterns1.Channels.DACCtrl.Number.setValue(i);
        // trigger a single capture, and wait for it to come in
        Scope1.single();
        Scope1.wait();
        // store our collected data
        levels.push(i);
        currentDACOutput = Scope1.Measurements.Average.value;
        measured.push(currentDACOutput);
        if (lastMeasurement > 0) {
            deltas.push(currentDACOutput - lastMeasurement);
        }
        lastMeasurement = currentDACOutput;
        print("\t" + currentDACOutput + "V");
    }
    // set data on the plot


    plot1.X.Range.setValue(7);
    plot1.X.Offset.setValue(-3.5);
    plot1.Y1.Units.text = "V";
    plot1.X.data = levels;
    plot1.Y1.data = measured;
    plot1.Y2.data = deltas; // unclear what use Y234 are

    // turn off all instruments
    allOff();

    // do some data processing and output
    stepTotal = 0;
    for (var i=1; i<8; i++) {
        stepTotal += deltas[i];
    }
    voltsPerBit = stepTotal / 7.0;

    print("difference between subsequent levels: \n" + plot1.Y2.data);

    print("Average bit voltage step: " + voltsPerBit + "V");
    print("Full scale: " + measured[0] + "V - " + measured[7] + "V ( " +
            (measured[7] - measured[0]) + "V range)");


    var outfile = getNonExistingFile("Name of CSV file to save for DAC data", "/tmp/DACOutput.csv");
    if (outfile ) {
        print("saving to csv out: " + outfile.getName());
        for (var i=0; i<8; i++) {
            outfile.appendLine(levels[i] + ","
                            + measured[i] + ","
                            + deltas[i]);
        }
    }


    return voltsPerBit;

}


function RingOscFrequencyMeasure() {

    // ensure we're good to go
    // the Tool.question() prompts user with GUI
    if (! Tool.question("Run Ring Oscillotr test?")) {
        print("Aborting");
        return 0;
    }


    RingOscEnable(true);
    Patterns1.run();
    scopeTriggerNormal();
    Scope1.run();
    return sampleAndAverageRingOscFreq();
}

function sampleAndAverageRingOscFreq() {
    total = 0;
    for (i=0; i<10; i++) {
        Scope1.single();
        Scope1.wait();
        curFreq = Scope1.Measurements.Frequency.value;
        total += curFreq;
        // print(curFreq);
    }

    avgFreq = total/10;
    print("Avg osc frequency: " + avgFreq);
    return avgFreq;

}

function getNonExistingFile(promptStr, defaultName) {
    /* returns a File object or false on cancel */
    var fname = Tool.getText(promptStr, defaultName);

    var outfile = File(fname);
    while (outfile.exists()) {
        fname = Tool.getText("Already exists: name a new name", fname);
        outfile = File(fname);
    }

    if (! fname ) { return false;}

    return outfile;
}


function RingOscFreqVsCoreV() {

    // ensure we're good to go
    // the Tool.question() prompts user with GUI
    if (! Tool.question("Run Ring OSC freq v Core supply test?")) {
        print("Aborting");
        return 0;
    }

    coreVoltages = []
    freqs = []

    // enable ring osc, and disable DAC
    RingOscEnable(true);
    DACEnable(false);
    // make sure the I/O is actually being sent
    Patterns1.run();
    setCoreVoltage(1.7000);

    var outfile = getNonExistingFile("Name of CSV file to save", "/tmp/HzvVolts.csv");
    if (outfile) {
        print("saving to csv out: " + outfile.getName());
    }

    // get the scope to trigger continuously
    scopeTriggerAuto();
    // ensure that instrument is running
    Scope1.run();
    for (var offsetV=0; offsetV<20; offsetV++) {
        coreV = 1.70000 + (offsetV/100.00);
        print("i is " + offsetV + " coreV is " + coreV);
        setCoreVoltage(coreV);
        coreVoltages.push(coreV);
        resultingFreq = sampleAndAverageRingOscFreq();
        freqs.push(resultingFreq);

        if (outfile) {
            outfile.appendLine(coreV + "," + resultingFreq);
        }
    }

    plot1.X.Range.setValue(0.2);
    plot1.X.Offset.setValue(-1.8);
    plot1.Y1.Units.text = "Hz";
    plot1.X.data = coreVoltages;
    plot1.Y1.data = freqs;
    // outfile.close();
    setCoreVoltage(1.8);

}


/* *** Serial Port/Demoboard setup *** */
function setModeAndProject(selectedPort) {
    var com = new SerialPort();
    if(!com.open(selectedPort, 115200)) throw "COM open failed"
            com.write("tt.mode = RPMode.ASIC_MANUAL_INPUTS\r\ntt.shuttle.tt_um_tt05_analog_test.enable()\r\n");
    com.readWait(1);
    returnedText = "";
    while(com.readAvailable()){
        returnedText += com.read(50);
        com.readWait(0.5);
    }
    com.close();
    print(returnedText);
}


function selectComPort() {

    var ports = SerialPortList(); // returns: [name 1, description 1, name 2, desc 2, ...]
    if (! ports.length) {
        print("No com ports available.");
        return false;
    }

    promptStr = "Select com port: ";
    for(var i = 0; i < ports.length; i+=2){
        // print(ports[i]+" : "+ports[i+1]);
        promptStr += ports[i] + " ";
    }
    return Tool.getText(promptStr, ports[0]);
}


clear();
CoreSupplyEnable(true);

selPort = selectComPort();
if (selPort) {
    print("Doing setup on demoboard at " + selPort);
    setModeAndProject(selPort);
    print("Demoboard READY");
}


RingOscFreqVsCoreV();
DACPlot();